

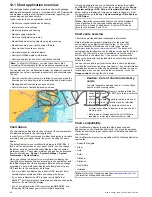
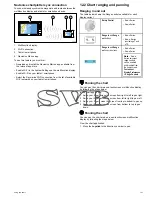


12.11 Tide information
Animated tide information
The electronic charts may allow animation of the tide information
tide stations.
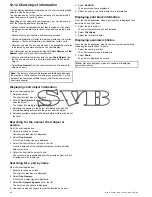
Animated tide information is available in the chart application
wherever a diamond-shaped symbol with a "T" is displayed:
This symbol identifies tide stations and the availability of tide
information for the location.
When you select a tide station symbol the chart context menu is
displayed, which provides the
Animate
option.
When you select
Animate
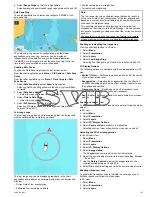
the animate menu is displayed and the
diamond–shaped symbols are replaced with dynamic tide bar which
indicates the predicted tide height for the actual time and date:
Tide animation.
• Tide height is indicated by a gauge. The gauge is comprised
of 8 levels, which are set according to the absolute minimum /
maximum values of that particular day.
• The color of the arrow on the tide gauges indicates changes in
the tide height:
–
Red
: increasing tide height.
–
Blue
: decreasing tide height.
The animation can be viewed continuously or incrementally at a
time interval that you specify. You can also set the date for the
animation, and start or restart the animation at any point within a
24-hour period. If the system does not have a valid date and time
the date used will be midday for the system default date.
Note:
Not all electronic charts support the animated tides feature.
Check the Navionics website:
www.navionics.com
to ensure the
features are available on your chosen cartography level.
Viewing animated tide information
From the chart application:
1. Select diamond-shaped tide icon.
The chart context menu is displayed.
2. Select
Animate
.
The animate menu is displayed and the tide icon is replaced with
a dynamic tide bar indicator.
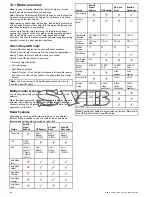
Controlling animations
From the chart application, with the animate menu displayed:
1. To start or stop the animation, select
Animate:
to switch
between Play and Pause.
2. To view the animation in steps, select
Step Back
or
Step
Forward
.
3. To set the animation step interval, pause any playing animations,
and then select
Set Time Interval
.
4. To set the animation date, select
Set Date
and then using the on
screen keyboard enter the required date.
5. To set the animation date to the current date select
Today
.
6. To set the animation date to 24 hours previous to the current
date select
Previous Day
.
7. To set the animation date to 24 hours ahead of the current date
select
Next Day
.
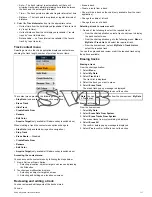
Displaying details of tides
From the chart application:
1. Select diamond-shaped tide icon.
The chart context menu is displayed.
2. Select
Tide Station
.
The tide graph for the selected tide station is displayed.
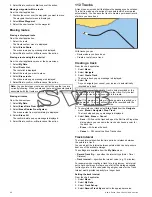
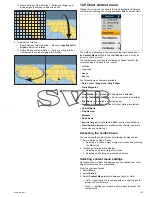
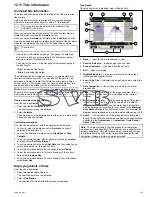
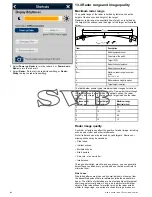
Tide graphs
Tide graphs provide a graphical view of tidal activity.
D
12294-1
1
4
5
2
8
6
1
0
9
3
7
1.
Back
— return to the previous menu or view.
2.
Sunrise indicator
— indicates when the sun rises.
3.
Sunset indicator
— indicates when the sun sets.
4.
Exit
— closes the dialog.
5.
Nightfall indicator
— the greyed-out section of the graph
indicates when nightfall occurs.
6.
Low / High Tide
— Indicates the time at which low or high tide
occurs.
7.
Date navigation
— Use the icons to move to the next or
previous day.
8.
Time
— The horizontal axis of the graph indicates time, in
accordance with the time format specified in the System
Settings.
9.
Minimum safe depth
— The blue shaded area of the graph
indicates the point during the tide cycle when it is safe to
navigate your vessel, based on the water depth at that time
and the settings you specified for your vessel in the
Minimum
Safe Depth
settings in the Customize menu. For example, the
diagram above is based on a minimum safe depth setting of 5 ft.
10.
Depth
— The vertical axis of the graph indicates tidal water
depth. The units for the depth measurement are based on those
specified in the
Homescreen > Customize > Units Set-up >
Depth Units
menu.
Note:
The data provided in the tide graphs is for information
purposes only and should NOT be relied upon as a substitute for
prudent navigation. Only official government charts and notices
to mariners contain all the current information needed for safe
navigation. Always maintain a permanent watch.
Using the chart
129
Summary of Contents for A65
Page 2: ......
Page 4: ......
Page 8: ...8 New a Series New c Series New e Series...
Page 12: ...12 New a Series New c Series New e Series...
Page 20: ...20 New a Series New c Series New e Series...
Page 36: ...36 New a Series New c Series New e Series...
Page 64: ...64 New a Series New c Series New e Series...
Page 86: ...86 New a Series New c Series New e Series...
Page 96: ...96 New a Series New c Series New e Series...
Page 106: ...106 New a Series New c Series New e Series...
Page 138: ...138 New a Series New c Series New e Series...
Page 192: ...192 New a Series New c Series New e Series...
Page 202: ...202 New a Series New c Series New e Series...
Page 206: ...206 New a Series New c Series New e Series...
Page 218: ...218 New a Series New c Series New e Series...
Page 228: ...228 New a Series New c Series New e Series...
Page 232: ...232 New a Series New c Series New e Series...
Page 242: ...242 New a Series New c Series New e Series...
Page 248: ...248 New a Series New c Series New e Series...
Page 286: ...286 New a Series New c Series New e Series...
Page 300: ...300 New a Series New c Series New e Series...
Page 307: ......
Page 308: ...www raymarine com...


