


PART 2: CX-Server PLC Tools
OMRON
CHAPTER 5 – Data Trace/Time Chart Monitor Component
CX-Server PLC Tools_ Page 65
2. Set the trigger condition that causes the data trace to start by selecting a
Symbol/Address
and
Value
on the
Trigger
tab. Use the
Browse
pushbutton to insert a known symbol from
the invoking application. If a bit address is selected, the trigger is based on a falling or
rising edge as opposed to a particular value for a word address: the
Value
field changes to
the
Edge
field.
3. For Time Chart Monitor only, establish the sampling time and
Buffer Size
on the
Sampling
tab.
4. Apply a delay value in the
Delay
field. A negative value in this field advances the start of
the trace before the trigger condition by the supplied interval value. A positive value in this
field delays the trace after the trigger condition by the supplied value in sampling.
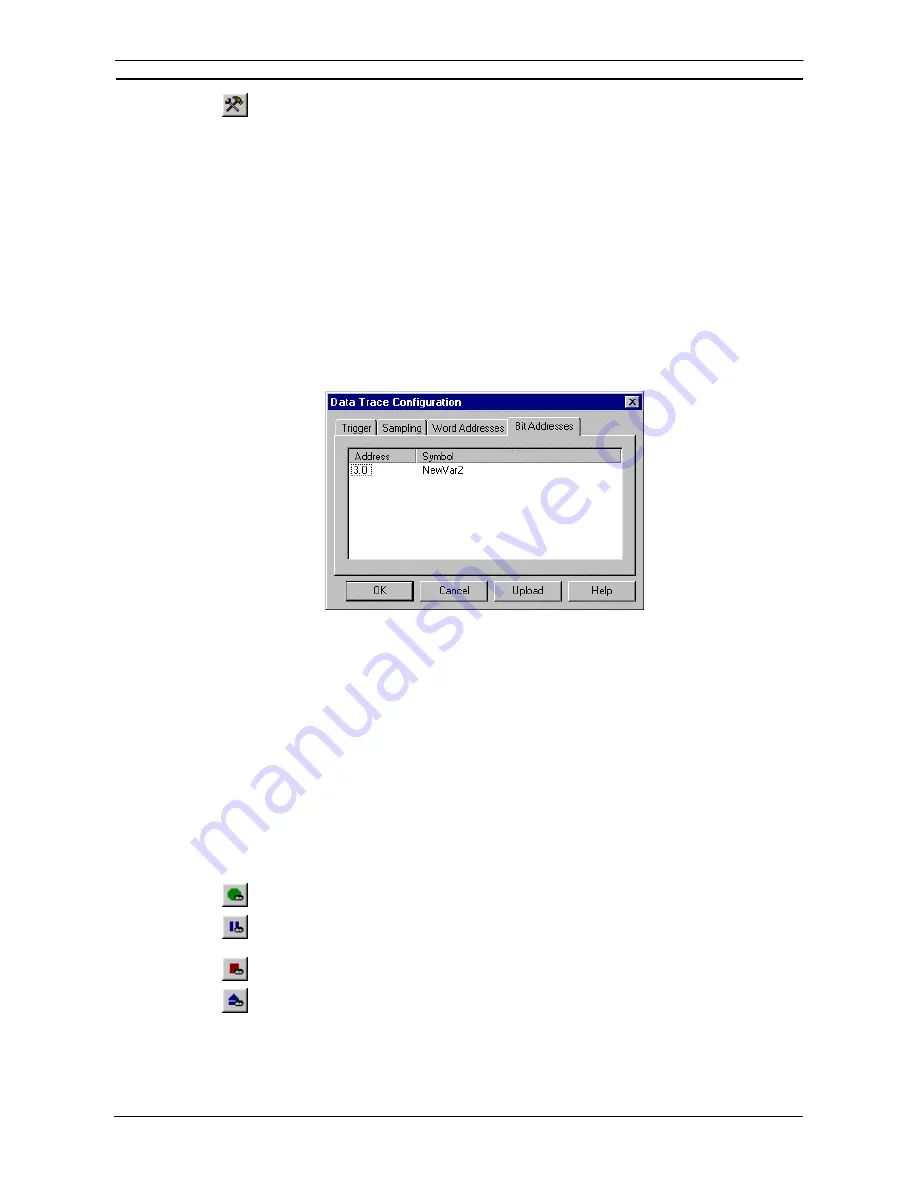
5. Select
the
Word Addresses
field on the
Word Addresses
tab and/or
Bit Addresses
on the
Bit
Addresses
tab) to be monitored.
6. Once all conditions have been set as required, click the
OK
pushbutton. Select the
Cancel
pushbutton to abort the configuration operation.
Use the following procedure to select the Word addresses or Bit addresses. It is possible to set only word
addresses, bit addresses, or a mix of both.
1, 2, 3…
1. Select a free area in the Address or Symbol columns with the right-mouse button and click
New
. The Address Selection dialog is displayed.
2. Insert an address in the
Address/Symbol
field, or select the
Browse
pushbutton to locate a
symbol from the invoking application.
3. Click
the
OK
pushbutton in the Address Selection dialog to accept the settings or select the
Cancel
pushbutton to abort the operation. The address or symbol is displayed in the Data
Trace Configuration dialog. Multiple addresses or symbols can be applied.
4. To delete an existing address or symbol, select an address or symbol with the right-mouse
button and click
Delete
.
When in the Data Trace mode of operation, the data trace configuration in the PLC can be uploaded and
viewed/edited for re-use. Select the
Upload
pushbutton from the Data Trace Configuration dialog.
Managing the Data Trace/Time Chart Monitor
Use the following functions to manage the Data Trace or Time Chart Monitor.
Select the
Execute
button from the toolbar to execute a data trace/time chart monitor.
Select the
Trigger
button from the toolbar to set the trigger condition so that execution will end
normally.
Select the
Stop
button from the toolbar to stop a data trace/time chart monitor.
Select the
Read
button from the toolbar to upload the data trace. This may take a few moments;
the status of the Read function can be verified by the information supplied in the status bar. The
Read
button is not used for the Time Chart Monitor mode of operation.
Summary of Contents for CX-Programmer 9
Page 1: ...Cat No W446 E1 10 CX Programmer Ver 9 SYSMAC WS02 CXPC_ V9 OPERATION MANUAL...
Page 2: ......
Page 3: ...SYSMAC WS02 CXPC V9 CX Programmer Ver 9 Operation Manual Revised December 2009...
Page 4: ......
Page 6: ......
Page 19: ...CX Programmer_Page xvi Unit Versions and Lot Numbers...
Page 30: ......
Page 31: ...PART 1 CX Programmer...
Page 32: ......
Page 100: ......
Page 120: ......
Page 198: ...PART 1 CX Programmer CHAPTER 4 Reference OMRON CX Programmer _Page 118...
Page 224: ...PART 1 CX Programmer Keyboard Shortcuts CX Programmer OMRON CX Programmer _Page 144...
Page 240: ......
Page 241: ...PART 2 CX Server PLC Tools...
Page 242: ......
Page 250: ......
Page 256: ......
Page 268: ...PART 2 CX Server PLC Tools CHAPTER 2 PLC Memory Component OMRON CX Server PLC Tools_Page 18...
Page 286: ......
Page 338: ......
Page 382: ......
Page 414: ......
Page 430: ......
Page 436: ......
Page 437: ...PART 3 CX Server Runtime...
Page 438: ......
Page 482: ......
Page 488: ......
Page 504: ......
Page 530: ......
Page 540: ......
Page 541: ......
Page 542: ......


