PART 2: CX-Server PLC Tools
CHAPTER 5 – Data Trace/Time Chart Monitor Component
OMRON
CX-Server PLC Tools_Page 64
Convenient Functions of Data Trace Window for CS/CJ/CP
Show Cursor/Trigger Position
♦
Select [Option]| [Measure]| [Value] on menu or click on
on tool bar. The value will be displayed. The
value of X axis (time axis) on cursor position will appear at the bottom of graph. The value of Y axis (present
value axis) will appear on Legend.
Change of cursor position is possible with dragging cursor.
To show the value on the point of the specified time axis, input the value into
on tool bar and
press [Enter] key or click on
on tool bar.
♦
Select [Options]| [Measure]| [Difference] on menu or click on
on tool bar. Measure Difference will
appear. Each value on X axis (time axis) of two cursors and the difference value will appear at the bottom of
graph. Each value on Y axis (present value axis) and difference value will appear on Legend.
Dragging each cursor or located on the top of cursor enables to change each cursor position separately.
Dragging located between two cursors enables to change cursor position while the interval of the two is kept.
♦
A value cursor is displayed on the trigger position. The values on the X axis (time axis) and Y axis (present
value axis) of the trigger position are displayed in the symbol list.
Zoom Select
♦
Select [View]| [Zoom Select] or click on
on tool bar. Zoom Select mode will be on. Select the graph area
to be enlarged by drag. The selected area only will be displayed on graph area. Only selected view will appear
on graph area when more areas to be enlarged are selected by drag. This operation is executable repeatedly.
♦
Select [View]| [Zoom Unselect] on menu or click on
on tool bar. The enlarged view after Zoom Select
will return to the previous one. To return the status prior to Zoom Select mode, select [View]| [Zoom Fit] or
click on
on tool bar.
For C/CV-series
Setting Monitoring Conditions
The Data Trace or Time Chart Monitor must be activated before the settings can be configured. To select Data
Trace or Time Chart Monitoring mode, select the
Mode
option from the
Operation
menu followed by either
Data
Trace
or
Time Chart Monitor
.
Note:
The mode of the Data Trace/Time Chart monitor component is identified prior to
activation from the invoking application.
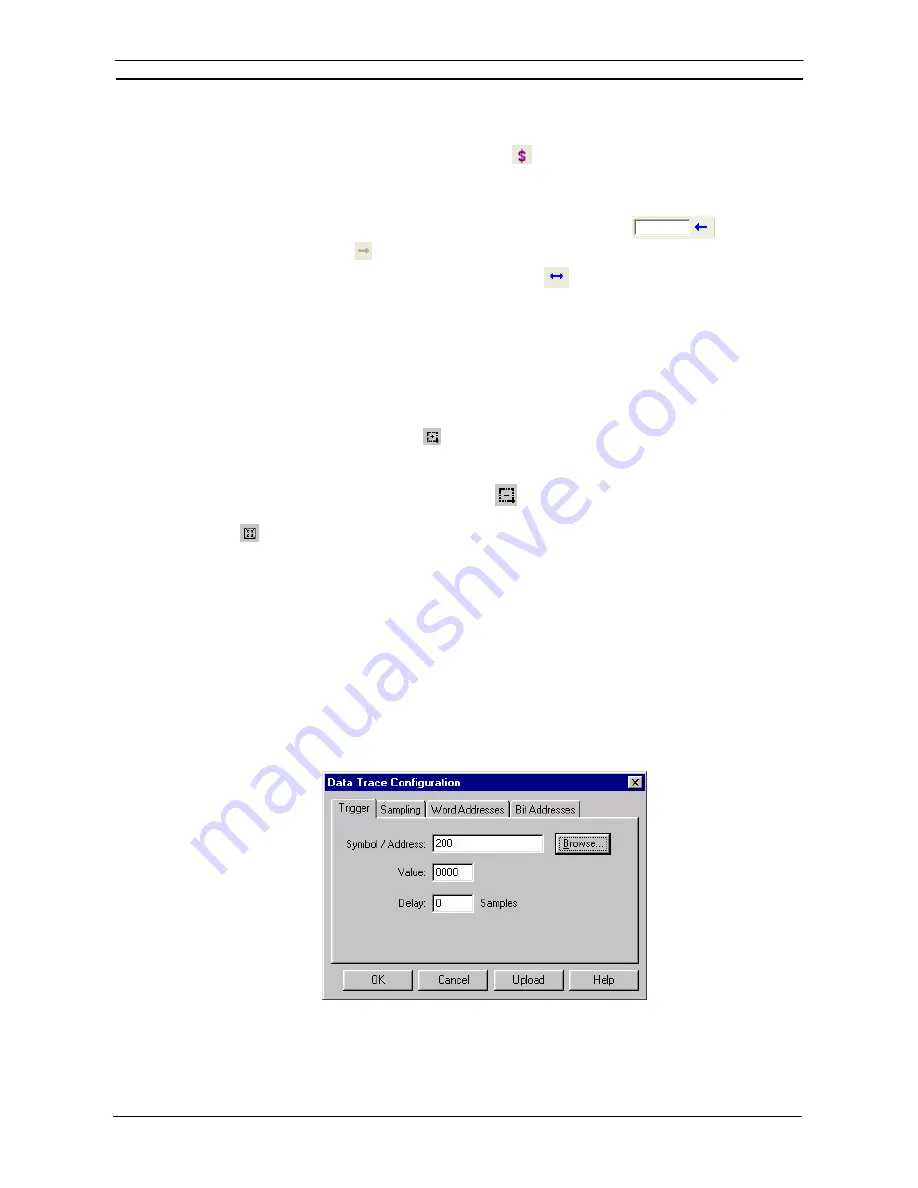
The Time Chart Monitor/Data Trace Configuration dialog allows the conditions for the Data Trace or Time Chart
Monitor to be set, i.e. specifying the data to be monitored, the intervals at which this is to occur and the trigger
conditions.
Use the following procedure to set conditions for the Data Trace or Time Chart Monitor modes.
1, 2, 3…
1. Select
the
Configure Trace/Time Chart
button from the toolbar.
Summary of Contents for CX-Programmer 9
Page 1: ...Cat No W446 E1 10 CX Programmer Ver 9 SYSMAC WS02 CXPC_ V9 OPERATION MANUAL...
Page 2: ......
Page 3: ...SYSMAC WS02 CXPC V9 CX Programmer Ver 9 Operation Manual Revised December 2009...
Page 4: ......
Page 6: ......
Page 19: ...CX Programmer_Page xvi Unit Versions and Lot Numbers...
Page 30: ......
Page 31: ...PART 1 CX Programmer...
Page 32: ......
Page 100: ......
Page 120: ......
Page 198: ...PART 1 CX Programmer CHAPTER 4 Reference OMRON CX Programmer _Page 118...
Page 224: ...PART 1 CX Programmer Keyboard Shortcuts CX Programmer OMRON CX Programmer _Page 144...
Page 240: ......
Page 241: ...PART 2 CX Server PLC Tools...
Page 242: ......
Page 250: ......
Page 256: ......
Page 268: ...PART 2 CX Server PLC Tools CHAPTER 2 PLC Memory Component OMRON CX Server PLC Tools_Page 18...
Page 286: ......
Page 338: ......
Page 382: ......
Page 414: ......
Page 430: ......
Page 436: ......
Page 437: ...PART 3 CX Server Runtime...
Page 438: ......
Page 482: ......
Page 488: ......
Page 504: ......
Page 530: ......
Page 540: ......
Page 541: ......
Page 542: ......


