Operator's Manual
WP700Zi-OM-E-RevA
54
6. Touch
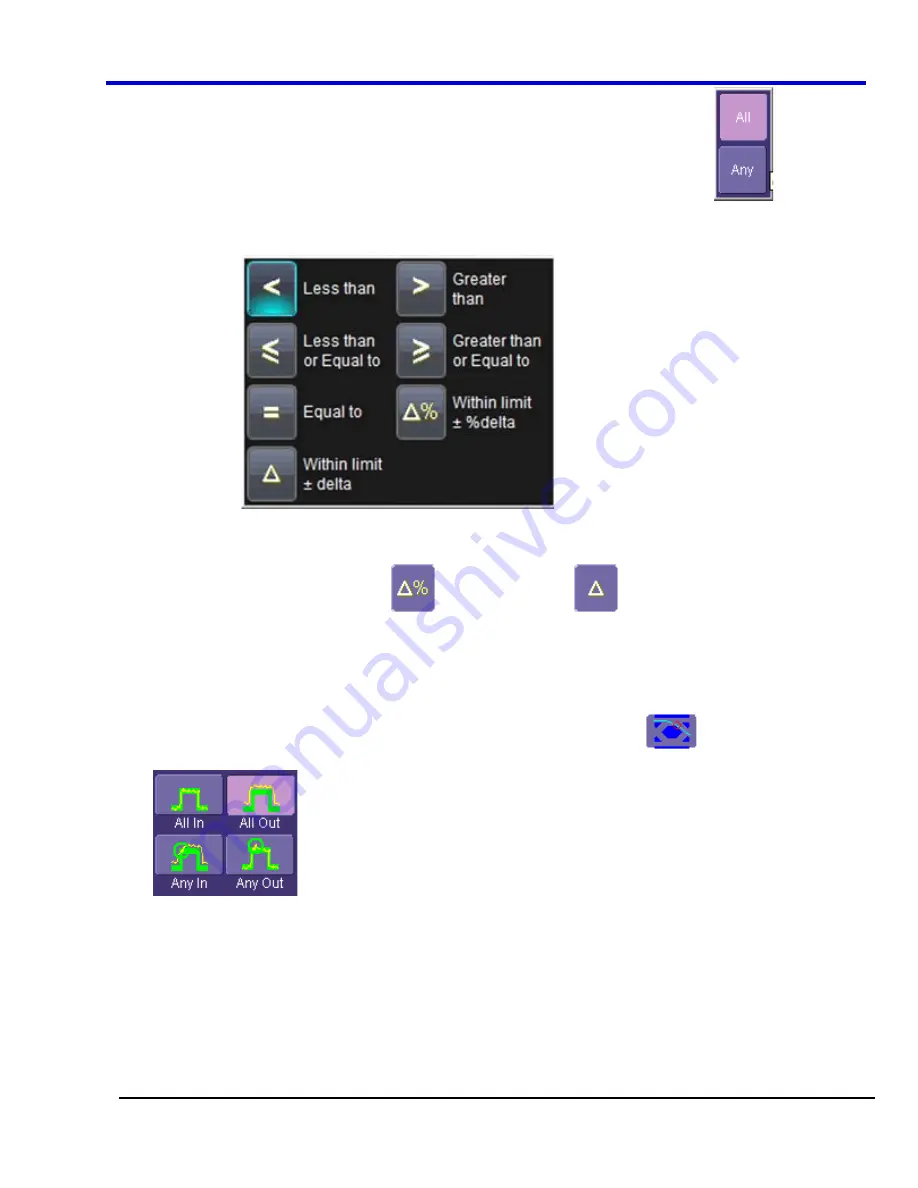
inside
the
Compare Values
field and select
All
or
Any
from the pop-up menu
. By selecting
All
, the test will be true only if every waveform falls within the limit that you will set. By selecting
Any
, the
test will be true if just one waveform falls within the limit.
7. Touch
inside
the
Condition
field in the
ParamCompare
mini-dialog and select a math operator from the
pop-up menu
.
8. Touch
inside
the
Limit
field and enter a value, using the pop-up numeric keypad. This value takes the
dimension of the parameter that you are testing. For example, if you are testing a time parameter, the unit
is seconds.
9.
If you chose either
WithinDeltaPct
or
WithinDeltaAbs
from the
Condition
menu, touch
inside the
Delta
field and enter a value.
Mask Testing
1. Touch
Analysis
Pass/Fail Setup...
from the menu bar.
2.
Touch one of the
Qx
tabs and a setup dialog for the position is shown.
3. Touch
inside
the
Source1
field and select a source from the pop-up menu.
4. Touch
inside
the
Condition
field in the main dialog and select
Mask Test
.
5. From
the
Test
portion of the dialog, make a selection in the
Test is True when
group of buttons
. This selection means, for example, that if you select
All In
the test is False when a
single waveform falls outside the mask.
6. From
the
Show Markers
section of the dialog, choose whether or not to have mask violations displayed.
7.
If you are loading a pre-existing mask, touch the
Load Mask
tab, and then the
File
button. You can then
enter the file name or browse to its location.
8.
If you want to make a mask from your waveform, touch the
Make Mask
tab.
9. Touch
inside
the
Ver Delta
and
Hor Delta
fields and enter boundary values, using the pop-up numeric
keypad.
10. Touch the
Browse
button to create a file name and location for the mask if you want to save it.
11. Touch the
Gate
tab, then enter values in the
Start
and
Stop
fields to constrain the mask to a portion of the
waveform. Or, you can simply touch and drag the Gate posts, which initially are placed at the extreme left
and right ends of the grid.
Summary of Contents for DDA 7 Zi series
Page 1: ...Operator s Manual WavePro SDA and DDA 7 Zi Series Oscilloscopes ...
Page 2: ... L R R H HUD RU D D ...
Page 41: ...Operator s Manual WP700Zi OM E RevA 40 The detachable WavePro Zi front panel ...
Page 376: ...WavePro 7Zi 375 WP700Zi OM E RevA Absolute Offset Relative ...
Page 439: ...Operator s Manual WP700Zi OM E RevA 438 ...
Page 440: ...WavePro 7Zi 439 WP700Zi OM E RevA ...
Page 544: ...Thank you for purchasing a WavePro SDA or DDA 7 Zi Oscilloscope ...