


Page 22-37
INDAT, MOHRC. Before re-ordering the variables, run the program once by
pressing the soft-key labeled
@MOHRC
. Use the following:
@MOHRC
Launches the main program MOHRCIRCL
25˜
Enter
σ
x = 25
75˜
Enter
σ
y = 75
50`
Enter
τ
xy = 50, and finish data entry.
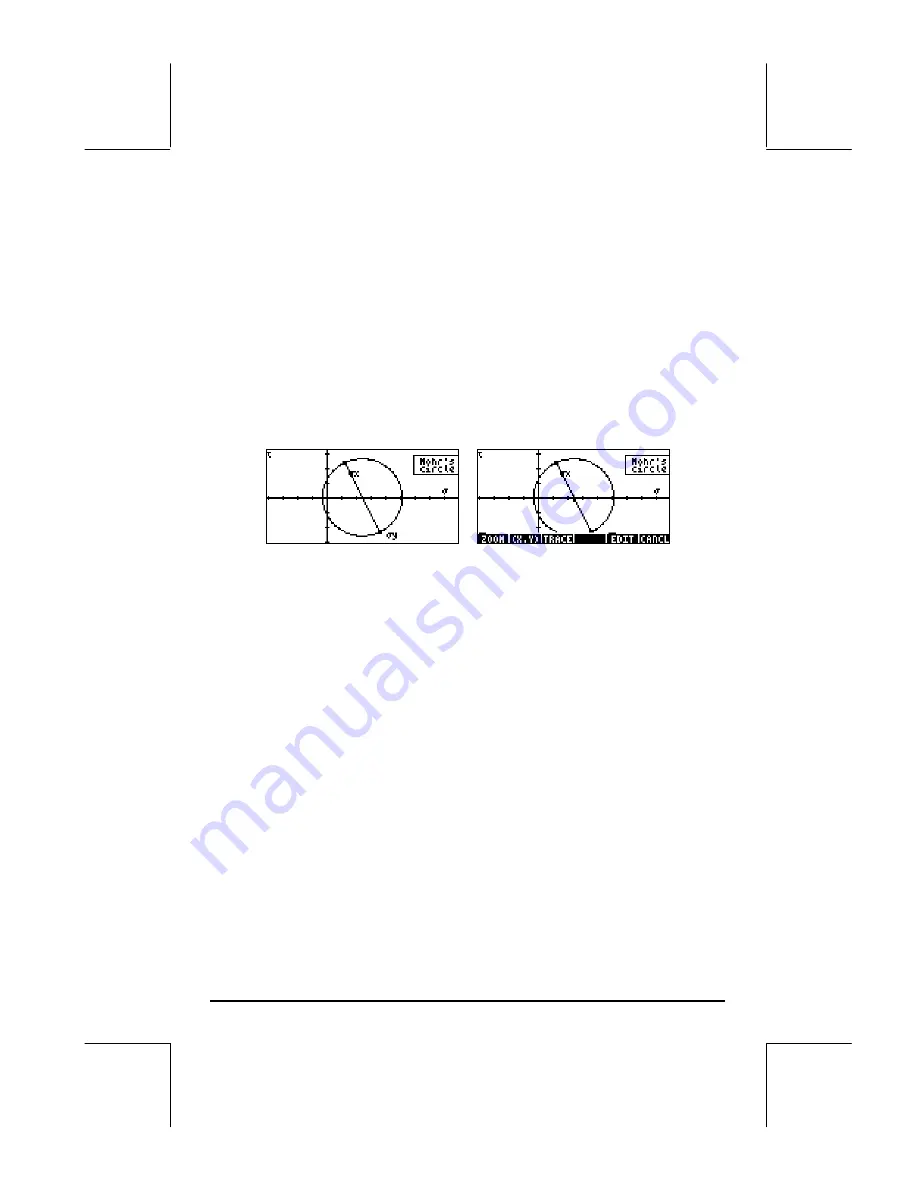
At this point the program MOHRCIRCL starts calling the sub-programs to
produce the figure. Be patient. The resulting Mohr’s circle will look as in the
picture to the left.
Because this view of PICT is invoked through the function PVIEW, we cannot
get any other information out of the plot besides the figure itself. To obtain
additional information out of the Mohr’s circle, end the program by pressing
$
. Then, press
š
to recover the contents of PICT in the graphics
environment. The Mohr’s circle now looks like the picture to the right (see
above).
Press the soft-menu keys
@TRACE
and
@
(
x,y
)
@
. At the bottom of the screen you will
find the value of
φ
corresponding to the point A(
σ
x,
τ
xy), i.e.,
φ
= 0,
(2.50E1, 5.00E1).
Press the right-arrow key (
™
) to increment the value of
φ
and see the
corresponding value of (
σ
’
xx
,
τ
’
xy
). For example, for
φ
= 45
o
, we have the
values (
σ
’
xx
,
τ
’
xy
) = (1.00E2, 2.50E1) = (100, 25). The value of
σ
’
yy
will be
found at an angle 90
o
ahead, i.e., where
φ
= 45 + 90 = 135
o
. Press the
™
key until reaching that value of
φ
, we find (
σ
’
yy
,
τ
’
xy
) = (-1.00E-10,-2.5E1)
= (0, 25).