


Page 22-13
and slope of a data fitting model, and the type of model to be fit to the data
in
Σ
DAT.
XCOL (H)
The command XCOL is used to indicate which of the columns of
Σ
DAT, if more
than one, will be the x- column or independent variable column.
YCOL (I)
The command YCOL is used to indicate which of the columns of
Σ
DAT, if more
than one, will be the y- column or dependent variable column.
MODL (J)
The command MODL refers to the model to be selected to fit the data in
Σ
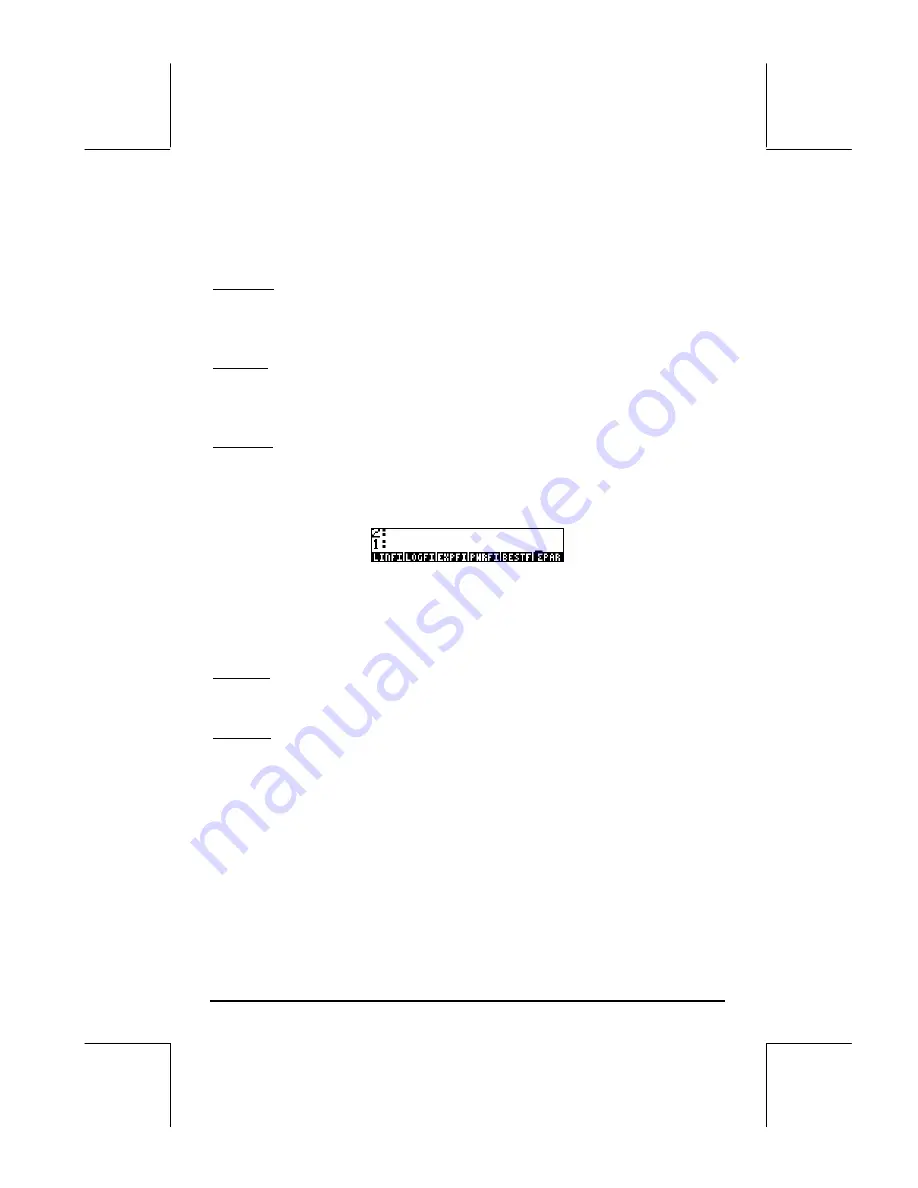
DAT, if a data fitting is implemented. To see which options are available,
press
@!MODL
. You will get the following menu:
These functions correspond to Linear Fit, Logarithmic Fit, Exponential Fit,
Power Fit, or Best Fit. Data fitting is described in more detail in a later
chapter. Press
)£@PAR
to return to the
Σ
PAR menu.
Σ
PAR (K)
Σ
PAR is just a reference to the variable
Σ
PAR for interactive use.
RESET (L)
This function resets the contents of
Σ
PAR to its default values.
Press
L
@)STAT
to return to the STAT menu. Press [PLOT] to return to the main
PLOT menu.
The FLAG menu within PLOT
The FLAG menu is actually interactive, so that you can select any of the
following options: