


Page 18-20
@CANCL
returns to main display
•
Determine the fitting equation and some of its statistics:
@)STAT
@)FIT@ @£LINE
produces
'1.5+2*X'
@@@LR@@@
produces
Intercept: 1.5, Slope: 2
3
@PREDX
produces
0.75
1
@PREDY
produces
3.
50
@CORR
produces
1.0
@@COV@@
produces
23.04
L
@PCOV
produces
19.74…
•
Obtain summary statistics for data in columns 1 and 2:
@)STAT
@)SUMS
:
@@@£X@@
produces 38.5
@@@£Y@@
produces 87.5
@@£X2@
produces 280.87
@@£Y2@
produces 1370.23
@@£XY@
produces
619.49
@@@N£@@
produces 7
•
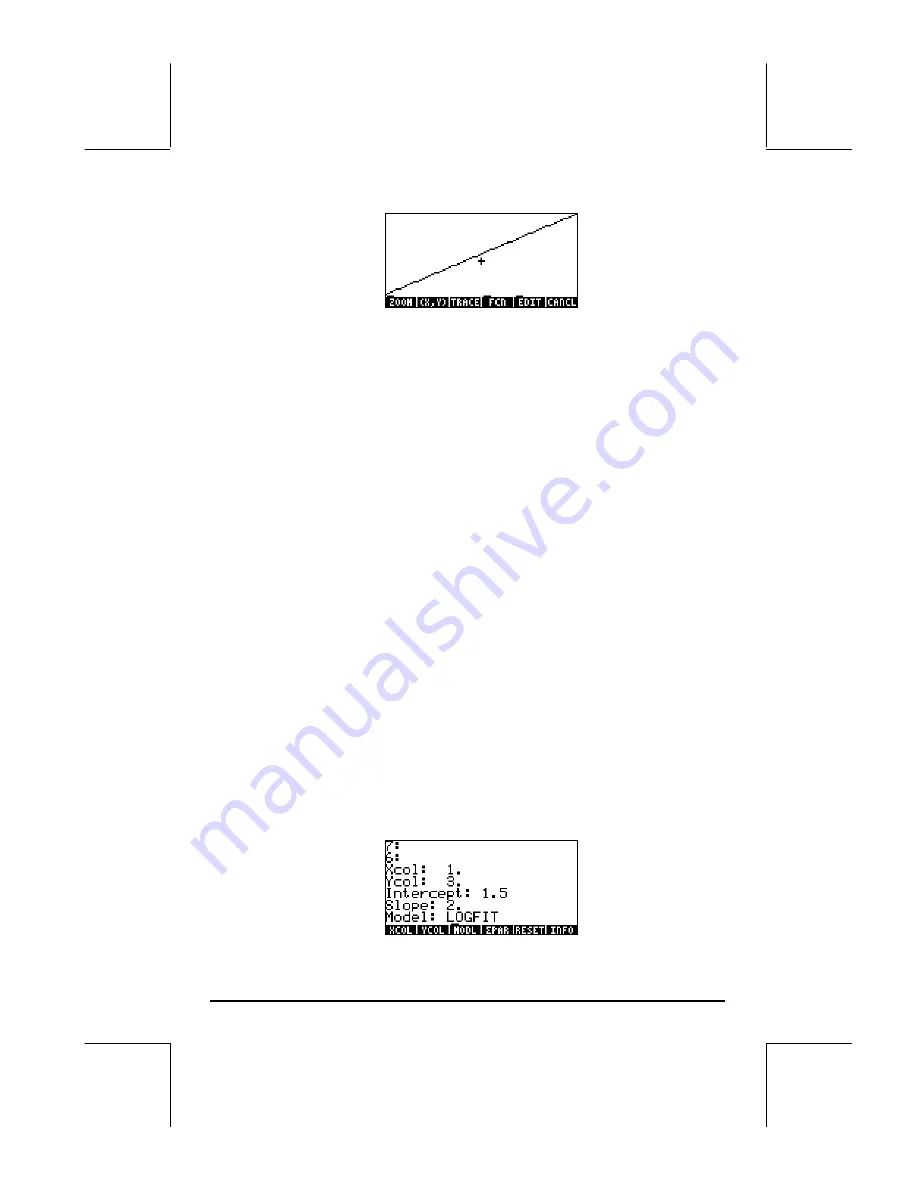
Fit data using columns 1 (x) and 3 (y) using a logarithmic fitting:
L
@)STAT
@)£PAR
3
@YCOL
select Ycol = 3, and
@)MODL
@LOGFI
select Model = Logfit