


Page 16-51
in the command catalog,
‚N
). Store the array into variable
Σ
DAT by
using function STO
Σ
(also available through
‚N
). Select Bar in the
TYPE for graphs, change the view window to H-VIEW: 0 32, V-VIEW: -10 10,
and BarWidth to 1. Press
@CANCL
$
to return to normal calculator display.
To perform the FFT on the array in stack level 1 use function FFT available in
the MTH/FFT menu on array
Σ
DAT:
@£DAT
FFT. The FFT returns an array of
complex numbers that are the arrays of coefficients X
k
of the DFT. The
magnitude of the coefficients X
k
represents a frequency spectrum of the
original data. To obtain the magnitude of the coefficients you could transform
the array into a list, and then apply function ABS to the list. This is
accomplished by using: OBJ
µ ƒ
LIST
„Ê
Finally, you can convert the list back to a column vector to be stored in
Σ
DAT,
as follows: OBJ
1 ` 2
LIST
ARRY STO
Σ
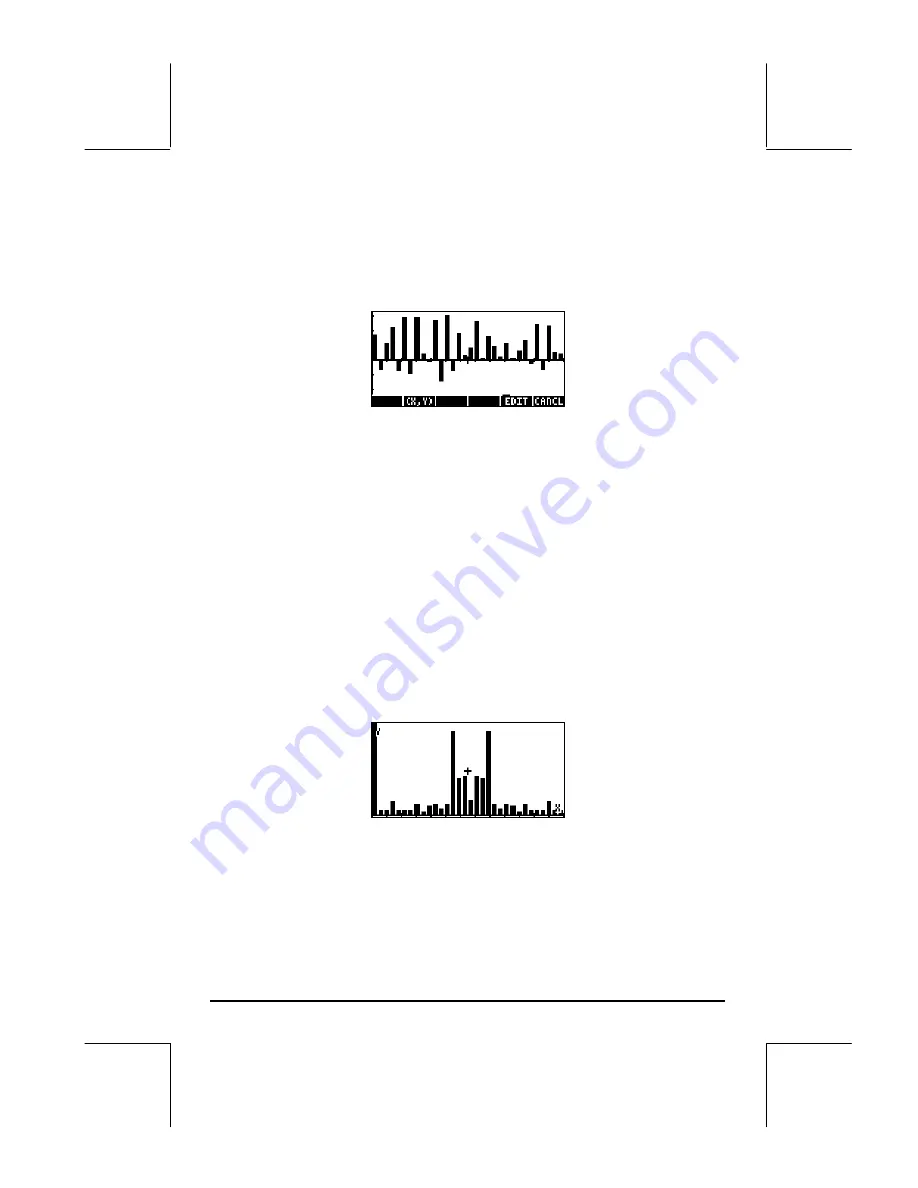
To plot the spectrum, follow the instructions for producing a bar plot given
earlier. The vertical range needs to be changed to –1 to 80. The spectrum of
frequencies is the following:
The spectrum shows two large components for two frequencies (these are the
sinusoidal components, sin (3x) and cos(5x)), and a number of smaller
components for other frequencies.