S5U1C17001C ManUal
EPSOn
10-17
(C COMPilEr PaCkagE fOr S1C17 faMily) (Ver. 1.5.0)
10 DEBUggEr
10
Debugger
notes
:
•
The maximum number of software PC breakpoints (including temporary breaks) that can be
set is 200. The maximum number of hardware PC breakpoints (including temporary breaks)
that can be set depends on the model. For more information, refer to the technical manual for
the model in question. If these limits are exceeded, including breakpoints set by command
input, an error will be assumed.
•
Software PC breakpoints cannot be set at addresses in external ROM.
•
PC breakpoints cannot be set at the lines listed below. Otherwise, an error is assumed.
- Lines of extended instructions, except the
ext
instruction at the beginning
- Lines of delay instructions (lines next to delayed branch instructions)
•
For other precautions on setting PC breakpoints, see the description of
break
,
tbreak
,
hbreak
and
thbreak
commands.
Executing the program up to a specified position
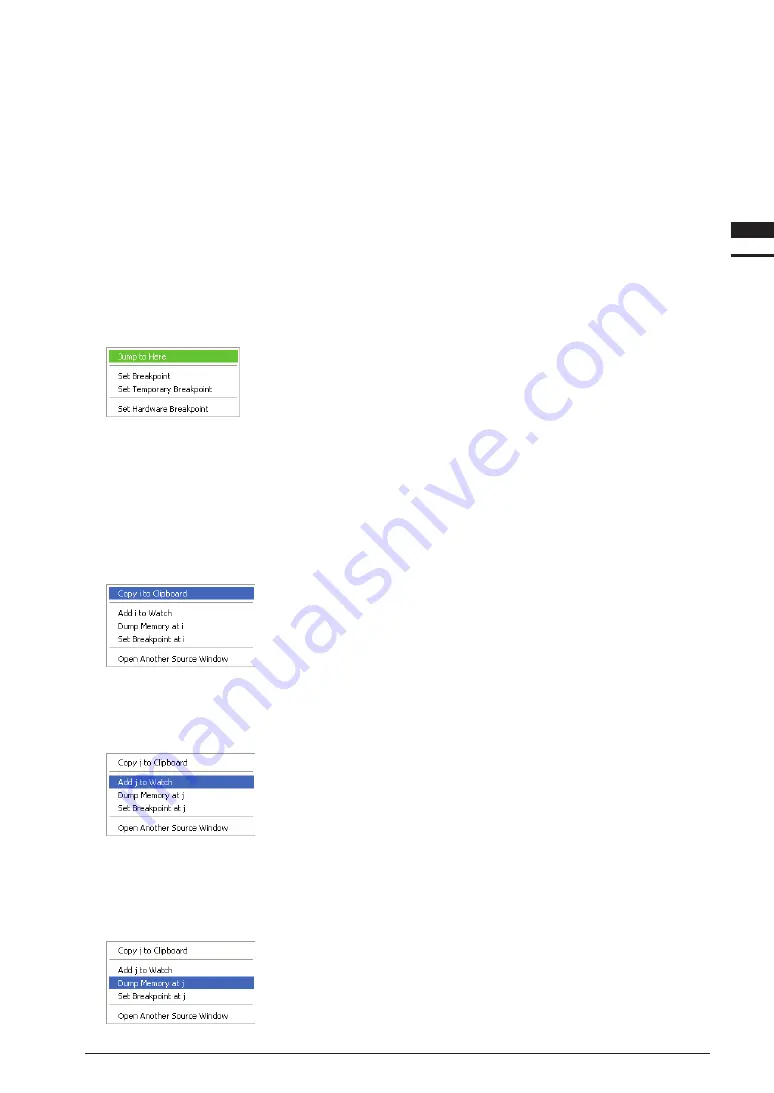
Right-click near the "–" mark at the beginning of a line to display the popup menu shown below.
Choose [Jump to Here] from this menu to start running the target program from
the current PC address, then stopping it at this line. (This is not effective unless the
program processes this line.)
note
: The debugger sets a temporary software PC breakpoint to stop the program. Therefore, the
precautions on setting software PC breakpoints described above also apply in this case.
Note that this function is valid even if software PC breakpoints have already been set at 200
locations (maximum).
Copying symbols
Variable names and function names can be copied to the clipboard using a popup menu. To use this function,
change the display format to [SOURCE]. Place the cursor over a variable name, function name, or label, and
right-click. This displays the popup menu shown below.
Select [Copy
<symbol>
to Clipboard] from this menu to copy the symbol name
to the clipboard.
registering symbols in the watch list
The global symbols you wish to register in the [Watch Expressions] window can be selected from the [Source]
window. To use this function, choose display format [SOURCE]. Place the cursor over a global variable name,
then right-click to display the popup menu shown below.
Choose [Add
<symbol>
to Watch] from this menu to register the selected
symbol in the [Watch Expressions] window, allowing you to monitor the
contents of the variable.
Symbol-specified memory dump
Choose a symbol in the [Source] window to display a new [Memory] window, with the contents displayed there
starting from the address indicated by the value of the selected symbol. To use this function, choose display
format [SOURCE]. Place the cursor over a symbol whose memory contents you wish to dump, then right-click
to display the popup menu shown below.
Choose [Dump Memory at
<symbol>
] from this menu to display a new
[Memory] window, showing the contents of memory beginning with the selected
symbol value.
Summary of Contents for S5U1C17001C
Page 6: ......
Page 17: ...1 General S5U1C17001C Manual 1 General ...
Page 18: ......
Page 21: ...1 2 Install S5U1C17001C Manual 2 Installation ...
Page 22: ......
Page 29: ...3 SoftDev S5U1C17001C Manual 3 Software Development Procedures ...
Page 30: ......
Page 103: ...4 SrcFiles S5U1C17001C Manual 4 Source files ...
Page 104: ......
Page 121: ...5 IDE S5U1C17001C Manual 5 gnU17 iDE ...
Page 122: ......
Page 365: ...6 Compiler S5U1C17001C Manual 6 C Compiler ...
Page 366: ......
Page 385: ...7 Library S5U1C17001C Manual 7 library ...
Page 386: ......
Page 405: ...8 Assemblr S5U1C17001C Manual 8 assembler ...
Page 406: ......
Page 439: ...9 Linker S5U1C17001C Manual 9 linker ...
Page 440: ......
Page 449: ...10 Debugger S5U1C17001C Manual 10 Debugger ...
Page 450: ......
Page 626: ...11 Tools S5U1C17001C Manual 11 Other Tools ...
Page 627: ......
Page 696: ...S1C17 Family C Compiler Package Quick Reference Reference ...


