20060301
8-4 Controlling Geometry Window Appearance
This section provides information about how to control the appearance of the Geometry
application window by scrolling or zooming, and by showing or hiding axes and the grid.
Configuring View Window Setting
s
You can use the following procedures to configure settings that control the appearance of the
Geometry application window.
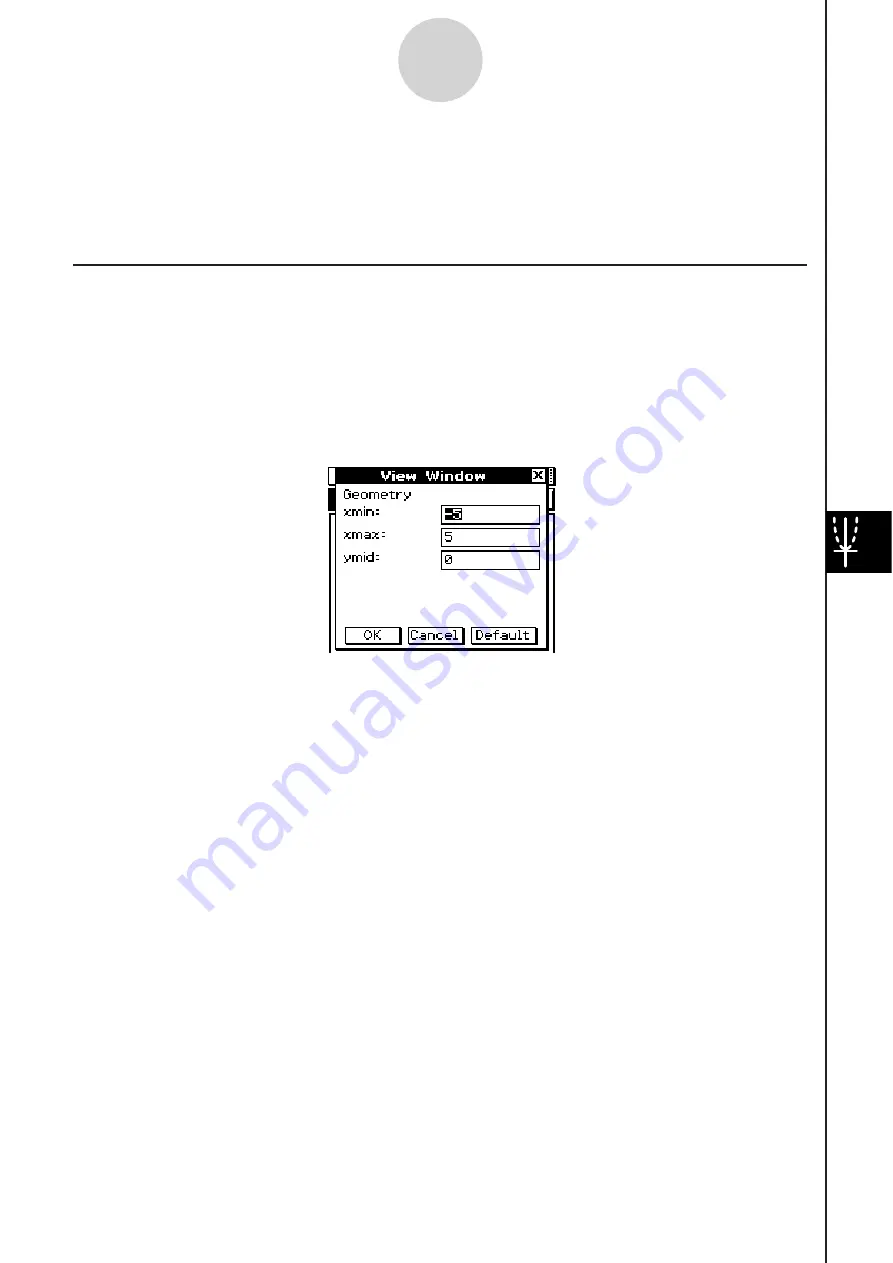
Tap
, and then [View Window] to display the View Window dialog box. The View Window
dialog box allows you to configure the
x
-axis range of values. The
y
mid value is used to
center the Graph window vertically. For example, if we set
y
mid = 2, then the
y
-axis will
appear 2 units below the center of the Graph window.
8-4-1
Controlling Geometry Window Appearance
Summary of Contents for ClassPad 330
Page 11: ...20060301 20090601 ClassPad 330 ClassPad OS Version 3 04 ...
Page 277: ...20060301 3 3 10 Storing Functions 3 Tap AND Plot OR Plot ...
Page 779: ...20090601 S Graph Line Clustered C S Graph Line Stacked E 13 9 2 Graphing ...
Page 780: ...20090601 S Graph Line 100 Stacked F S Graph Column Clustered G 13 9 3 Graphing ...
Page 781: ...20090601 S Graph Column Stacked I S Graph Column 100 Stacked J 13 9 4 Graphing ...
Page 782: ...20090601 S Graph Bar Clustered K S Graph Bar Stacked 9 13 9 5 Graphing ...


