20090601
Example
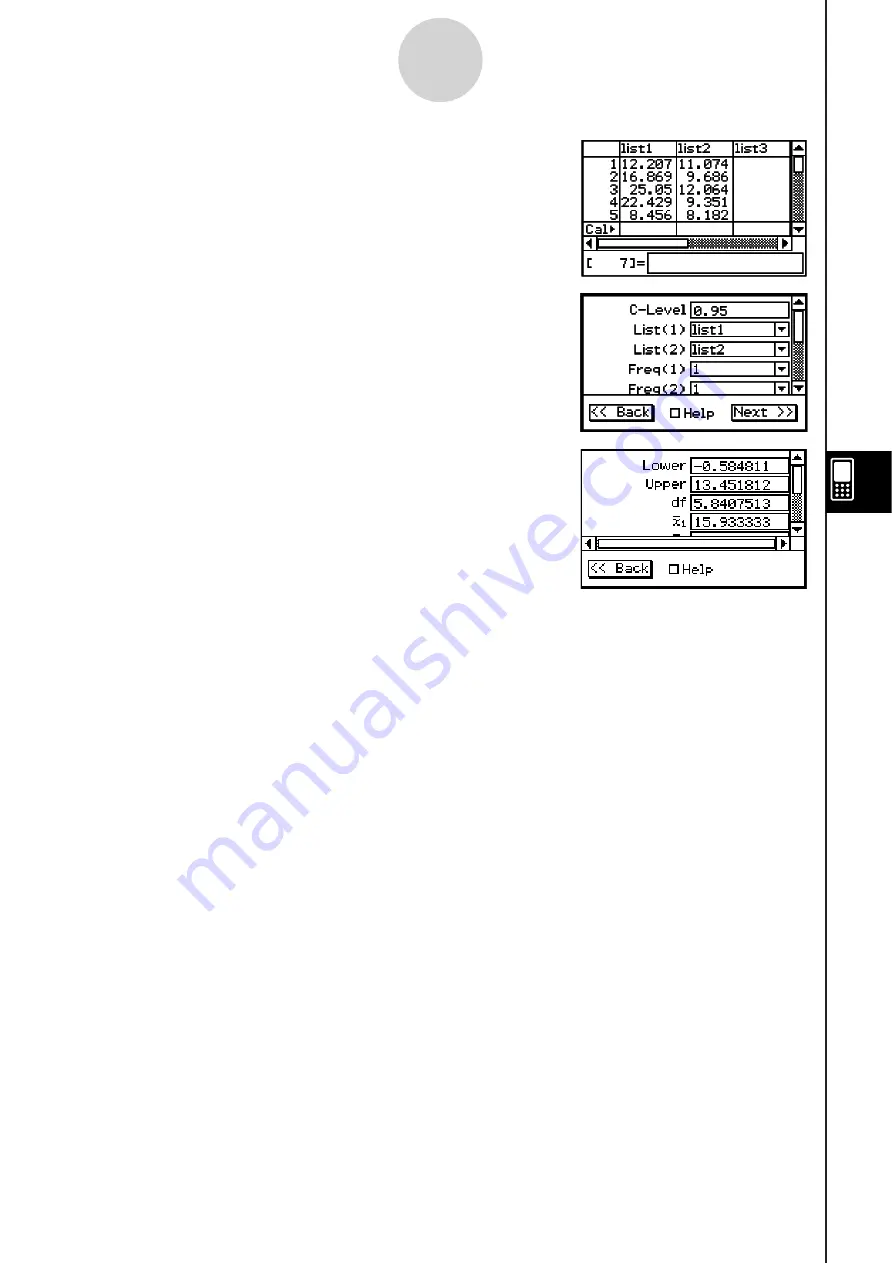
list1 : { 12.207, 16.869, 25.05, 22,429, 8.456, 10.589 }
list2 : { 11.074, 9.686, 12.064, 9.351, 8.182, 6.642 }
Significance level : 5% ( = confidence level : 95%)
• Stati
s
tic
s
Wizard Operation
(1) Input the data into [list1] and [list2] in the Stat Editor.
(2) On the menu bar, tap [Calc] and then [Interval].
(3) Select [Two-Sample TInt] and then tap [Next >>].
(4) Input value.
(5) Select List(1) [list1], List(2) [list2], Freq(1) [1],
Freq(2) [1] and Pooled [Off].
(6) Tap [Next >>].
S
Program, eActivity or Main Application
Command:
TwoSampleTInt
:
Command Syntax
Syntax 1 (li
s
t format)
C-Level value, List(1), List(2), Freq(1) (or 1), Freq(2) (or 1), Pooled condition (On
or Off)
* “Freq” can be omitted. Doing so sets “1” for “Freq”.
* “Pooled” can be omitted. Doing so sets “Off” for “Pooled”.
Syntax 2 (parameter format)
C-Level
value,
M
1
value, s
x
1
value,
n
1
value,
M
2
value, s
x
2
value,
n
2
value, Pooled
condition (On or Off)
* “Pooled” can be omitted. Doing so sets “Off” for “Pooled”.
Input Example:
Syntax 1 (li
s
t format)
TwoSampleTInt 0.95,list1,list2,1,1,Off
Syntax 2 (parameter format)
TwoSampleTInt 0.95,80.4,2.07,30,84.2,1.96,35,On
7-10-10
Confidence Intervals
Summary of Contents for ClassPad 330
Page 11: ...20060301 20090601 ClassPad 330 ClassPad OS Version 3 04 ...
Page 277: ...20060301 3 3 10 Storing Functions 3 Tap AND Plot OR Plot ...
Page 779: ...20090601 S Graph Line Clustered C S Graph Line Stacked E 13 9 2 Graphing ...
Page 780: ...20090601 S Graph Line 100 Stacked F S Graph Column Clustered G 13 9 3 Graphing ...
Page 781: ...20090601 S Graph Column Stacked I S Graph Column 100 Stacked J 13 9 4 Graphing ...
Page 782: ...20090601 S Graph Bar Clustered K S Graph Bar Stacked 9 13 9 5 Graphing ...


