20090601
7-9-11
Tests
Calculation Re
s
ult Output
μ
1
x
μ
2
:
test condition
t
:
t
value
p
:
p
-value
df
:
degrees of freedom
M
1
:
sample mean of sample 1 data
M
2
:
sample mean of sample 2 data
s
x
1
:
sample standard deviation of sample 1
s
x
2
:
sample standard deviation of sample 2
s
p
:
Pooled sample standard deviation (Displayed only when pooling is
turned on.)
n
1
:
size of sample 1
n
2
:
size of sample 2
Example
list1 : {−8522, 316, −9001, 6470, 8956, 4348, 8571,
2142, −7139, 9925, 1260}
list2 : {176, 5498, 4830, 9457, 6486, 9607, −8334,
−1771, 7919, −2997}
• Stati
s
tic
s
Wizard Operation
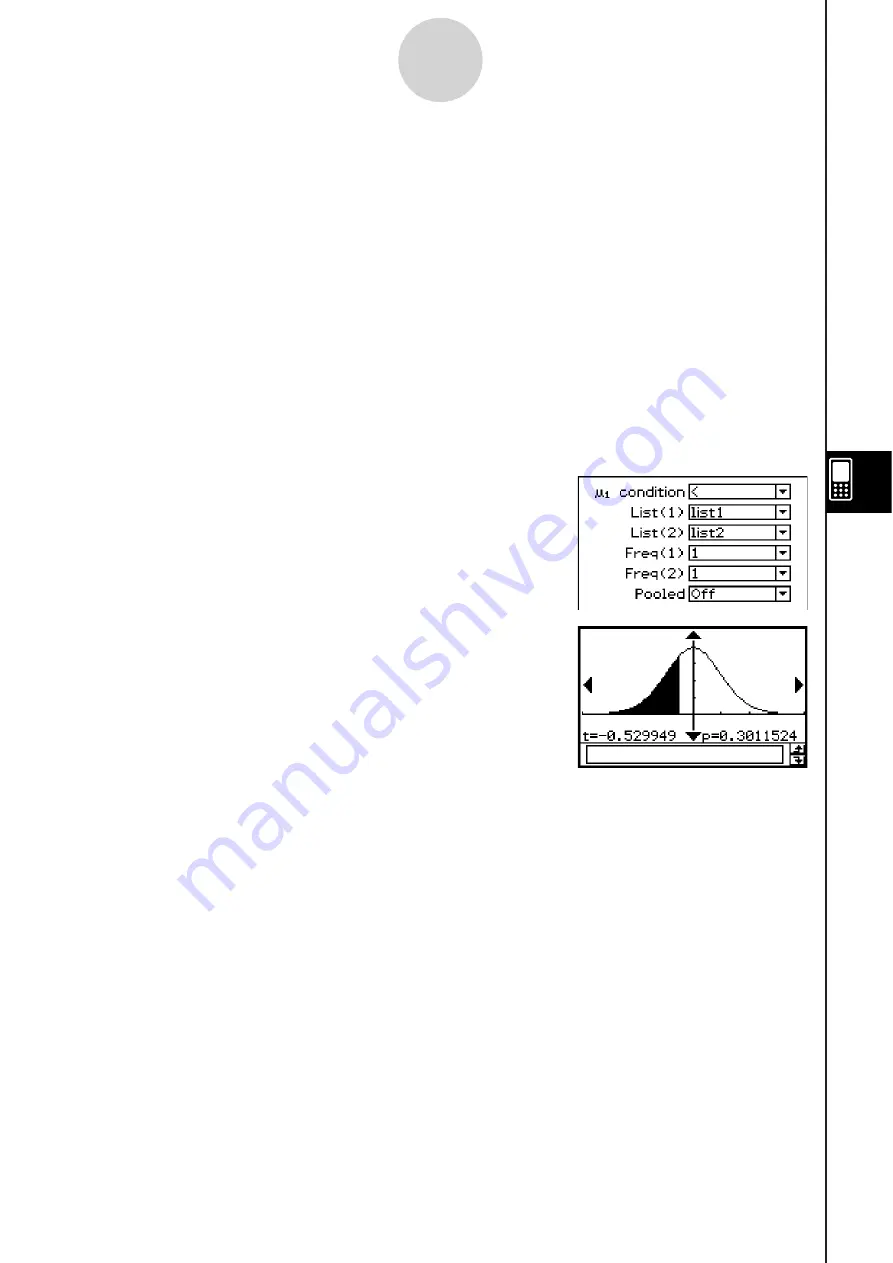
(1) Input the data into [list1] and [list2] in the Stat Editor.
(2) On the menu bar, tap [Calc] and then [Test].
(3) Select [Two-Sample TTest] and [List], and then tap
[Next
>>].
(4) Select the
μ
1
condition [<].
(5) Select List(1) [list1], List(2) [list2], Freq(1) [1],
Freq(2) [1] and Pooled [Off].
(6) Tap [Next >>].
(7) To display the graph, tap the
.
S
Program, eActivity or Main Application
Command:
TwoSampleTTest
:
Command Syntax
Syntax 1 (li
s
t format)
“
μ
1
condition”, List(1), List(2), Freq(1) (or 1), Freq(2) (or 1), Pooled condition (On
or Off)
* “Freq” can be omitted. Doing so sets “1” for “Freq”.
* “Pooled” can be omitted. Doing so sets “Off” for “Pooled”.
Syntax 2 (parameter format)
“
μ
1
condition”,
M
1
value, s
x
1
value,
n
1
value,
M
2
value, s
x
2
value,
n
2
value, Pooled
condition (On or Off)
* “Pooled” can be omitted. Doing so sets “Off” for “Pooled”.
Summary of Contents for ClassPad 330
Page 11: ...20060301 20090601 ClassPad 330 ClassPad OS Version 3 04 ...
Page 277: ...20060301 3 3 10 Storing Functions 3 Tap AND Plot OR Plot ...
Page 779: ...20090601 S Graph Line Clustered C S Graph Line Stacked E 13 9 2 Graphing ...
Page 780: ...20090601 S Graph Line 100 Stacked F S Graph Column Clustered G 13 9 3 Graphing ...
Page 781: ...20090601 S Graph Column Stacked I S Graph Column 100 Stacked J 13 9 4 Graphing ...
Page 782: ...20090601 S Graph Bar Clustered K S Graph Bar Stacked 9 13 9 5 Graphing ...


