20060301
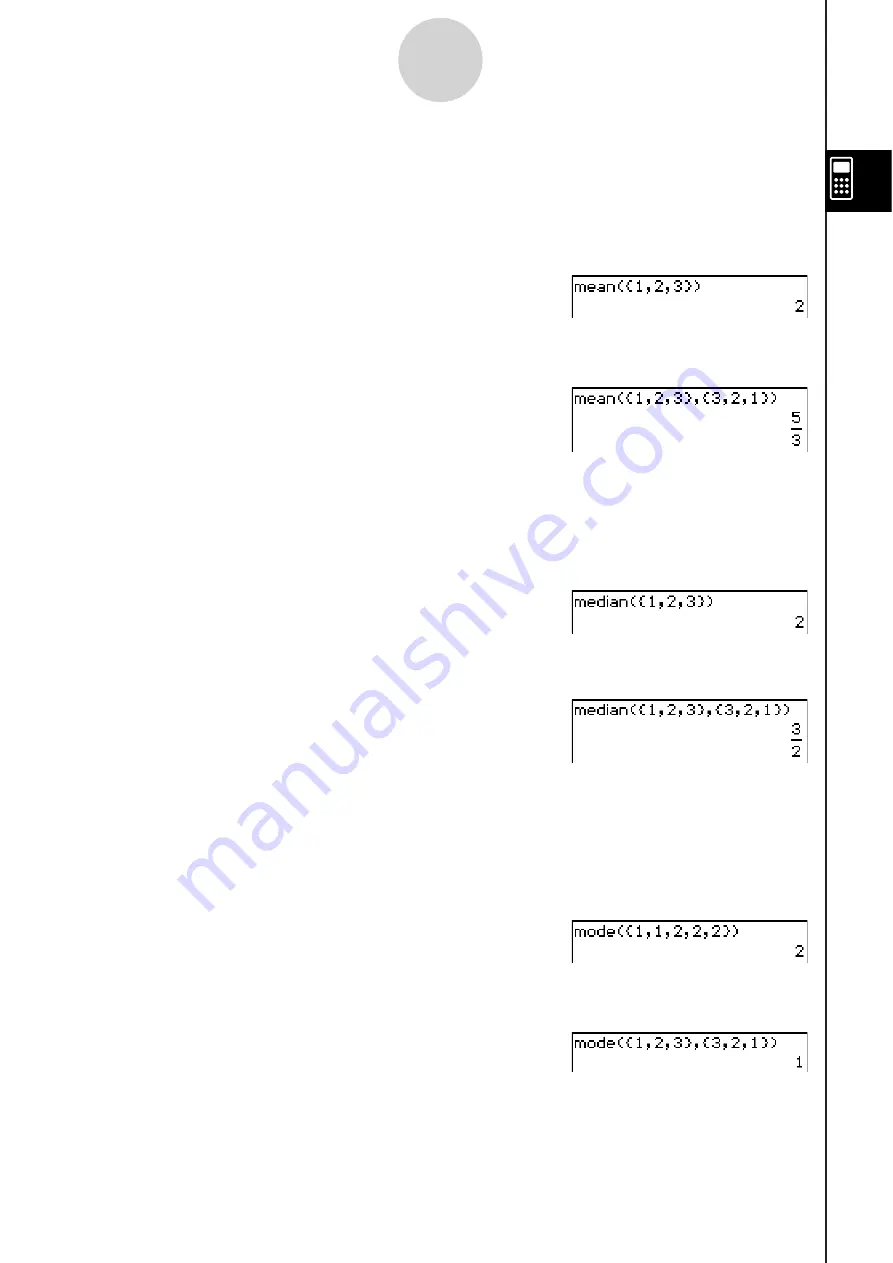
Example: To determine the mean of the elements in the list {1, 2, 3}, whose respective
frequencies are {3, 2, 1}
Menu Item: [Action][List-Calculation][mean]
S
median
Function: Returns the median of the elements in a list.
Syntax: median (List-1[, List-2] [ ) ]
• “List-2” specifies the frequency of each element in “List-1”.
Example: To determine the median of the elements in the list {1, 2, 3}
Menu Item: [Action][List-Calculation][median]
Example: To determine the median of the elements in the list {1, 2, 3}, whose respective
frequencies are {3, 2, 1}
Menu Item: [Action][List-Calculation][median]
S
mode
Function: Returns the mode of the elements in a list.
Syntax: mode (List-1[, List-2] [ ) ]
• “List-2” specifies the frequency of each element in “List-1”.
Example: To determine the mode of the elements in the list {1, 1, 2, 2, 2}
Menu Item: [Action][List-Calculation][mode]
Example: To determine the mode of the elements in the list {1, 2, 3}, whose respective
frequencies are {3, 2, 1}
Menu Item: [Action][List-Calculation][mode]
• If there are multiple modes, they are returned in a list.
2-8-26
Using the Action Menu
S
mean
Function: Returns the mean of the elements in a list.
Syntax: mean (List-1[, List-2] [ ) ]
• “List-2” specifies the frequency of each element in “List-1”.
Example: To determine the mean of the elements in list {1, 2, 3}
Menu Item: [Action][List-Calculation][mean]
Summary of Contents for ClassPad 330
Page 11: ...20060301 20090601 ClassPad 330 ClassPad OS Version 3 04 ...
Page 277: ...20060301 3 3 10 Storing Functions 3 Tap AND Plot OR Plot ...
Page 779: ...20090601 S Graph Line Clustered C S Graph Line Stacked E 13 9 2 Graphing ...
Page 780: ...20090601 S Graph Line 100 Stacked F S Graph Column Clustered G 13 9 3 Graphing ...
Page 781: ...20090601 S Graph Column Stacked I S Graph Column 100 Stacked J 13 9 4 Graphing ...
Page 782: ...20090601 S Graph Bar Clustered K S Graph Bar Stacked 9 13 9 5 Graphing ...


