QIAcuity User Manual 06/2022
246
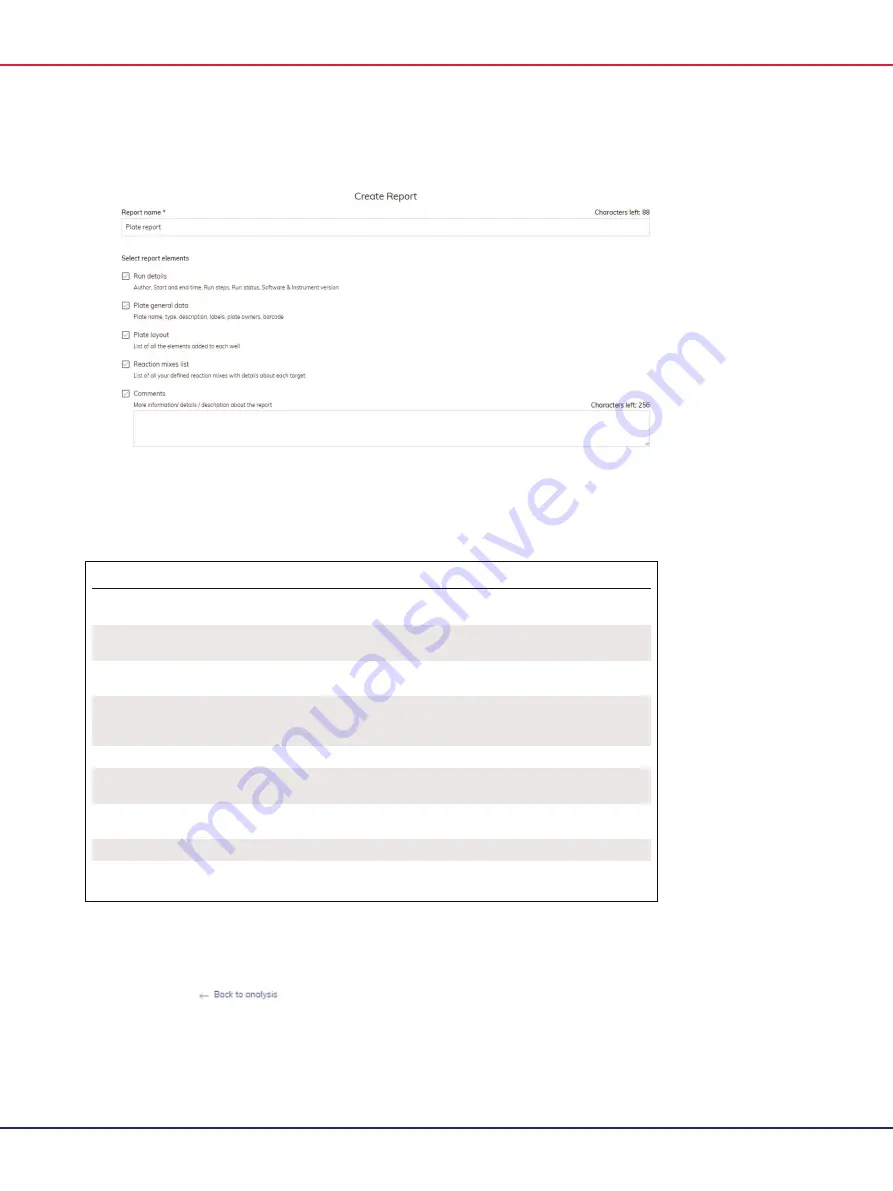
Create Report view for a plate
8.
Use this table as a guide in selecting which information to include in the report.
Table 17. Report elements
Element
Description
Report name
Every Report needs a specific name, without special
characters ~ ‘ “ ! @ ^( ) = [ ] { } : ; , < > | \ .
Run details
User, Start and end time, Run steps, Run status, Software
and Instrument version, dPCR steps
Plate general data
Plate name, type, description, plate owners, labels,
barcode
dPCR parameters
Priming profile, Cycling profile (temperature with time
duration), Imaging profile (channel, exposure duration,
gain)
Plate layout
List of all the elements added to each well
Reaction mixes list
List of all your defined reaction mixes with details about
each target
Comments
More information/details/descriptions
Result table
Concentration and error values, partitions
Signers
Users who signed report
Note
: The Diagrams or Result tables from analysis option are only available if diagrams are selected
to be added to the report.
Note
: Clicking the
icon opens the plate analysis view but the preselected diagrams
will be lost!
Содержание QIAcuity 911000
Страница 2: ...QIAcuity User Manual 06 2022 2...
Страница 68: ...QIAcuity User Manual 06 2022 68...
Страница 126: ...QIAcuity User Manual 06 2022 126 Pressing the Users list button will bring you to the list of all users and their status...
Страница 178: ...QIAcuity User Manual 06 2022 178 Raw image of a well showing dust particles marked with red circles...
Страница 207: ...QIAcuity User Manual 06 2022 207 To open an individual plot click on the appropriate header of the 1D Scatterplot...
Страница 240: ...QIAcuity User Manual 06 2022 240...


