QIAcuity User Manual 06/2022
198
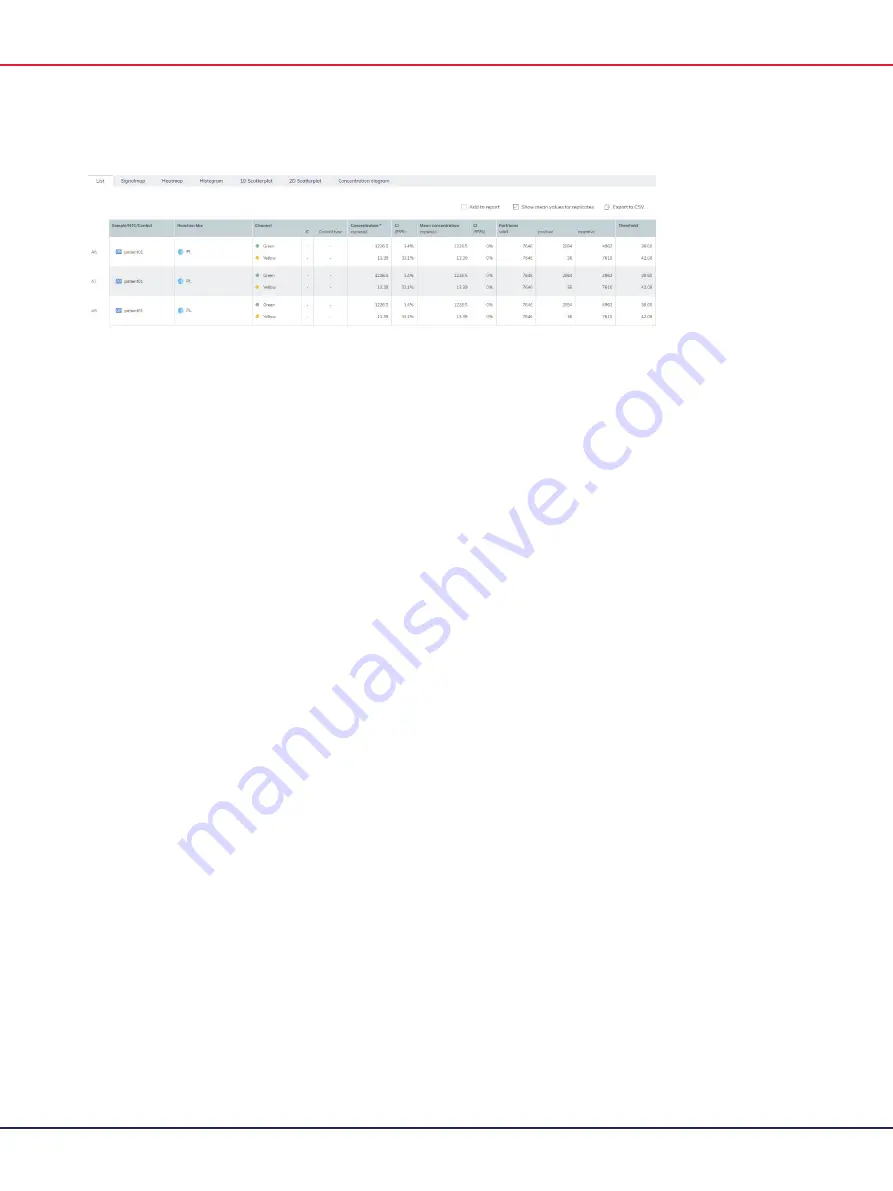
List tab with selected mean values for replicates.
Signalmap tab for absolute quantification
The
Signalmap
tab provides positive partitions for target channels and valid partitions for the
reference channel of selected wells. For each channel included in target or channel selection, one
signal map view is created. The signal map views are sorted by channel position in imaging
(“Green”, “Yellow”, “Orange”, “Red”, “Crimson”), separated by a horizontal line.
With this view the user can visually check the influence of threshold settings on the partition
distribution and consider the impact of artefacts that he might have discovered in the source image
view.
Each signal map represents the plate layout for a selected channel where only the images of the
selected wells are loaded. Remaining wells are displayed as grey squares. When the image of a
well could not be calculated by the algorithm, a placeholder image is shown. On hovering the
mouse over the well, the user is informed that the signal map for this well could not be created.
The title of a signal map shows the channel name and in case that more than one well is selected
also the number of selected wells.
When the user hovers with the mouse over a well, a tooltip is shown informing about the label of
the given well and, if defined, about the associated target. On hovering the well image, the image
is highlighted and the cursor changes to the zoom icon.
Содержание QIAcuity 911000
Страница 2: ...QIAcuity User Manual 06 2022 2...
Страница 68: ...QIAcuity User Manual 06 2022 68...
Страница 126: ...QIAcuity User Manual 06 2022 126 Pressing the Users list button will bring you to the list of all users and their status...
Страница 178: ...QIAcuity User Manual 06 2022 178 Raw image of a well showing dust particles marked with red circles...
Страница 207: ...QIAcuity User Manual 06 2022 207 To open an individual plot click on the appropriate header of the 1D Scatterplot...
Страница 240: ...QIAcuity User Manual 06 2022 240...


