QIAcuity User Manual 06/2022
221
1.
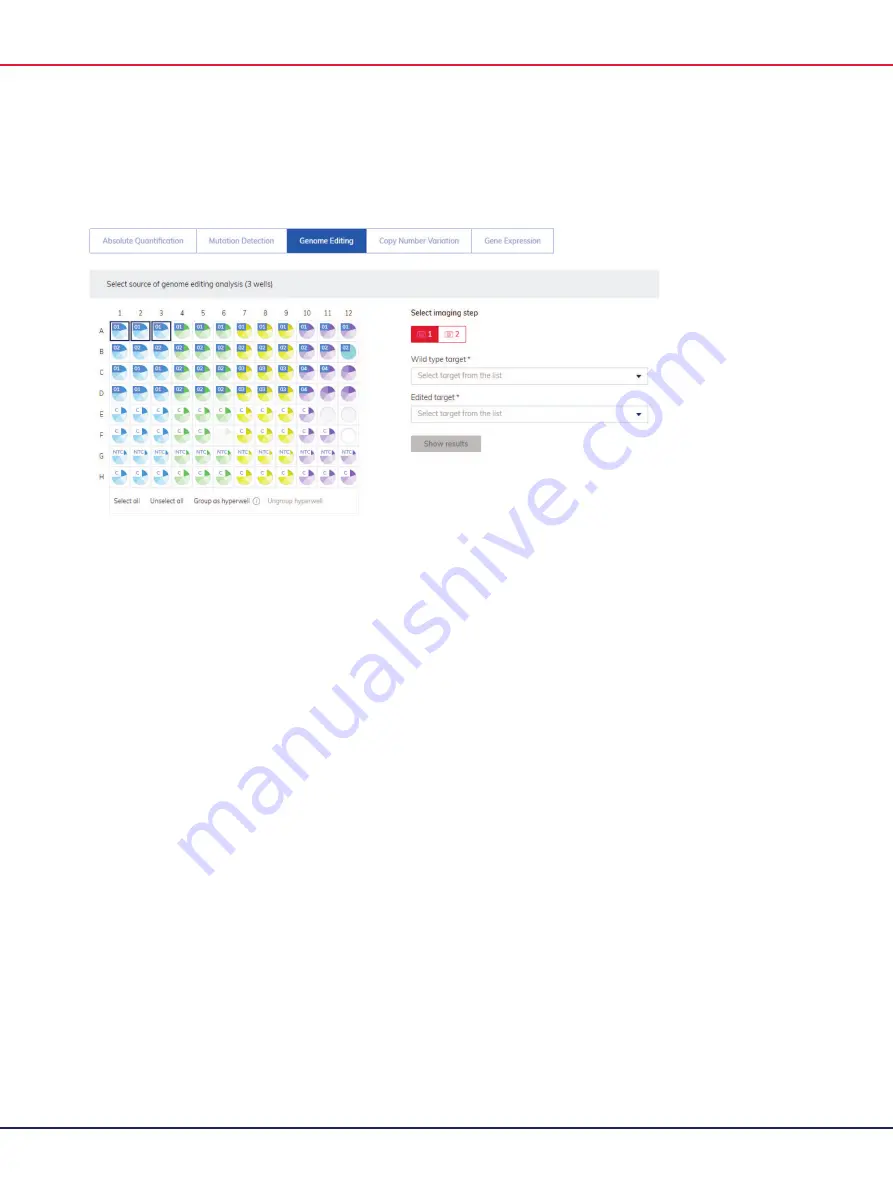
Click the applicable wells in the plate layout. For more information, see Selecting wells for
analysis.
2.
Select the applicable wild-type target from the
Wild type target
list.
3.
Select the applicable edited target from the
Edited target
list.
4.
To view the results of the analysis, click
Show results
.
5.
The results are divided into several tabs. To view the contents of the tab, click the tab title.
List tab for genome editing
The List tab contains a table with an overview of the analyzed wells. The following columns are
available in the table:
Well ID
– This column represents the well position in the plate layout.
Sample/NTC/Control
– This column shows the sample, NTC, or control name with its
corresponding icon that identifies the sample or indicates whether the entry is an NTC or
control.
Reaction mix
– This column contains the icon and the name of the well.
Target
– This column shows all target names with its corresponding target type. Targets that
were selected as wild type or edit type are marked accordingly.
Concentration (copies/ul)
– This column shows the concentration assigned to each target or
channel.
CI (95%)
– This column shows the value of the confidence interval at a 95% confidence level.
Edited fraction
– This column shows the edited fraction for the edited target as percentage.
CI (95%)
– This column shows the value of the confidence interval for the edited target at a
95% confidence level.
Содержание QIAcuity 911000
Страница 2: ...QIAcuity User Manual 06 2022 2...
Страница 68: ...QIAcuity User Manual 06 2022 68...
Страница 126: ...QIAcuity User Manual 06 2022 126 Pressing the Users list button will bring you to the list of all users and their status...
Страница 178: ...QIAcuity User Manual 06 2022 178 Raw image of a well showing dust particles marked with red circles...
Страница 207: ...QIAcuity User Manual 06 2022 207 To open an individual plot click on the appropriate header of the 1D Scatterplot...
Страница 240: ...QIAcuity User Manual 06 2022 240...


