START-UP
5
37
OPTIWAVE 1010
www.krohne.com
10/2016 - 4003537403 - MA OPTIWAVE 1010 R03 en
By default, each graph will be shown on a separate tab.
How to put two or more graphs on one tab:
•
Put your cursor on a tab.
•
Click and hold the mouse button down and pull the tab on another tab. The software will show
a symbol to show you where you can put the graph on the tab.
•
Make a selection from the available positions on the screen.
•
Release the mouse button.
i
End of the procedure. The graph will appear in its new position.
INFORMATION!
To record data in Imperial / USCS units (ft,
°
F etc.) in the analysis window, go to HART menu on
the "Parameters" window and change the length unit to ft (feet)
ft (feet)
ft (feet)
ft (feet) or in (inches)
in (inches)
in (inches)
in (inches).
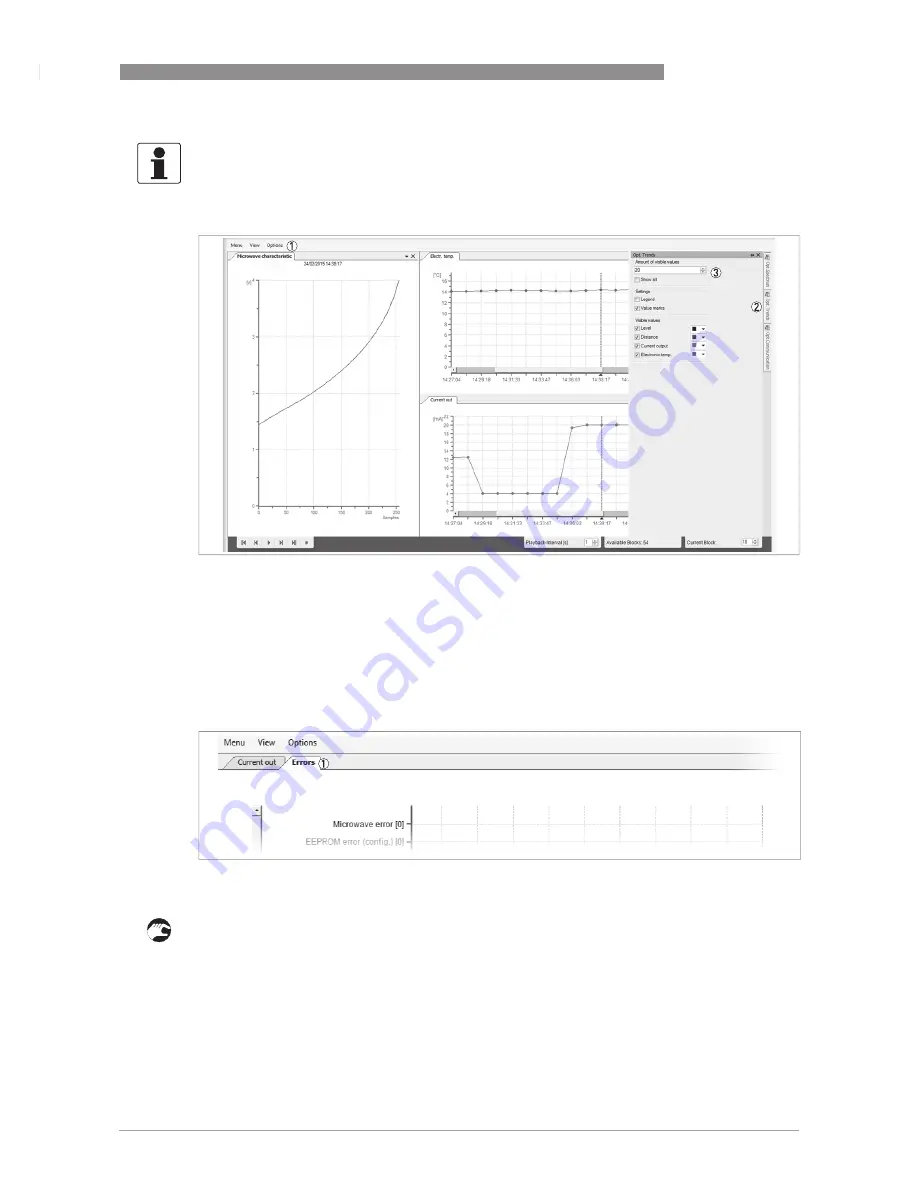
Figure 5-4: Options for the analysis screen
1
Options menu for data shown on graphs
2
Tab for Trend graph options. Put the cursor on the tab to see the options. There are also tabs for spectrum and com-
munication options.
3
Options for trend graphs: Change the number of points shown on the graph, change graph display settings (plotted
curves, plotted points and colours of plotted curves)
Figure 5-5: Analysis screen: graphs in tab mode
1
Tab for error data


