5
START-UP
36
OPTIWAVE 1010
www.krohne.com
10/2016 - 4003537403 - MA OPTIWAVE 1010 R03 en
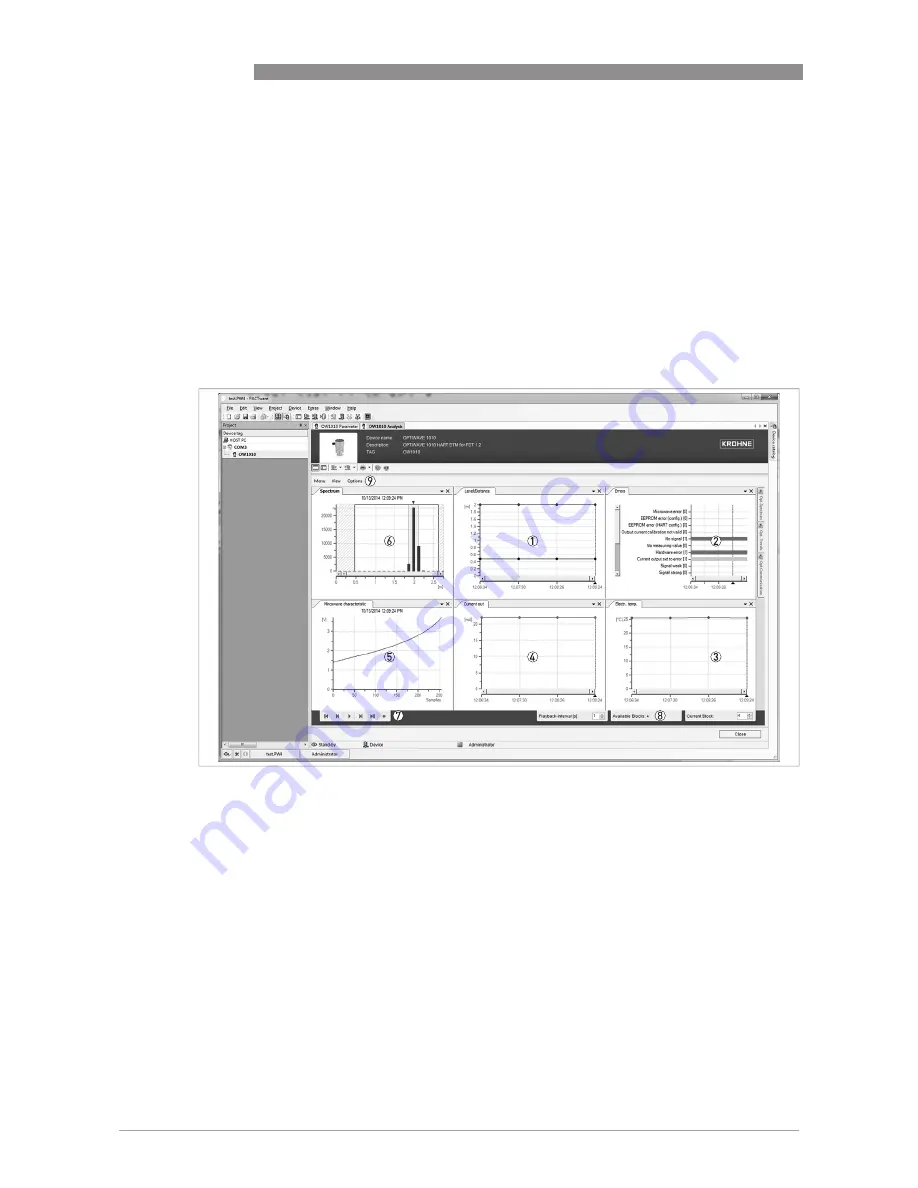
5.3.4 Analysis window
Use this data to monitor change and rate of change in level, distance, current output,
temperature of the electronics and device status. It is also possible to monitor spectrum values.
You can do one of these three procedures to open the Analysis window:
•
Open the window from the Start
Start
Start
Start window. Click on Start
Start
Start
Start in the DTM menu and then click on the
Analysis
Analysis
Analysis
Analysis button at the bottom of the Start
Start
Start
Start window.
•
Open the window from the main toolbar. Click on Device > Measured value > Analysis
Device > Measured value > Analysis
Device > Measured value > Analysis
Device > Measured value > Analysis.
•
Open the window from the Project
Project
Project
Project window. Right click on the device (OPTIWAVE 1010
OPTIWAVE 1010
OPTIWAVE 1010
OPTIWAVE 1010) in the
project list, then click on Measured value > Analysis
Measured value > Analysis
Measured value > Analysis
Measured value > Analysis.
Figure 5-3: DTM: Analysis screen
1
Graph: Level or distance [m] against time [time after the device was energized]
2
Graph: Device status against time [time after the device was energized]
3
Graph: Electronics block temperature (
°
C or
°
F) against time [time after the device was energized]
4
Graph: Current output (mA) against time [time after the device was energized]
5
Graph: Microwave characteristic (V) against the number of measurement samples
6
Graph: Spectrum (signal strength) against distance (metres or inches)
7
Controls to record blocks of measurement data
In this sequence from left to right: go to the first data block, go to the data block before this data block, play / stop, go
to the data block after this data block, go to the last data block, and record / stop
8
Data about the blocks
In this sequence from left to right: time to see each data block when you push the [play] button, number of data blocks
recorded, data block shown at this time
9
Data display options. There are three menus: Menu, View and Options.
Menu: use this menu to delete, save or load data
View: use this menu to show data as graphs in PACTware
™
Spectrum options: show the distance or the spectrum lines
Trend options (level/distance; errors, electronics block temperature and current output): Change the number of points
shown on the graph, change graph display settings (plotted curves, plotted points and colours of plotted curves).
Communication options: the time to get data from the device and the number of times the software will try to get data
from the device before it shows an error message


