624
Using Data & Statistics
2. Click to grab. The cursor changes to
ù
. Drag the cursor to the desired
position and release.
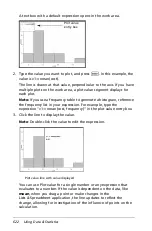
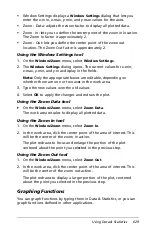
Dilation
Dilation retains the shape of the axes, but enlarges or reduces the size.
1. Position the cursor over a tic mark or label near the ends of the axis.
The cursor changes to
ó
on the vertical axis or
ô
on the horizontal
axis.
2. Click to grab. The cursor changes to
÷
. Drag the cursor to the desired
position and release.
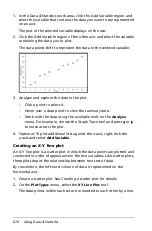
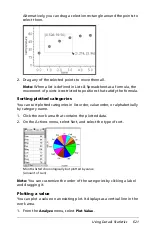
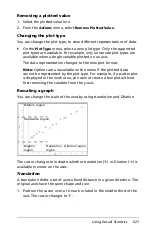
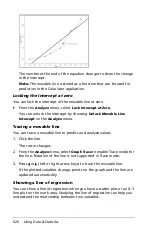
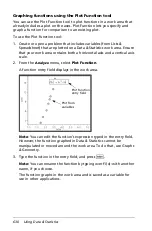
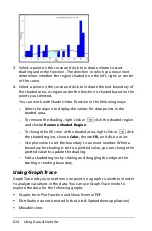
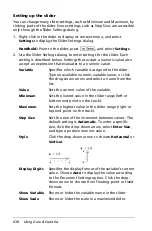
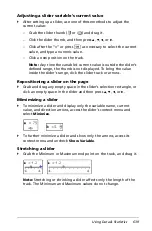
Adding a movable line
You can add a movable line to a plot. Moving and rotating the line on
the work area changes the function that describes it.
`
From the
Analyze
menu, select
Add Movable Line
.
Содержание TI-Nspire
Страница 38: ...26 Setting up the TI Nspire Navigator Teacher Software ...
Страница 46: ...34 Getting started with the TI Nspire Navigator Teacher Software ...
Страница 84: ...72 Using the Content Workspace ...
Страница 180: ...168 Capturing Screens ...
Страница 256: ...244 Embedding documents in web pages ...
Страница 332: ...320 Polling students For detailed information on viewing and sorting poll results see Using the Review Workspace ...
Страница 336: ...324 Polling students ...
Страница 374: ...362 Using the Review Workspace ...
Страница 436: ...424 Calculator ...
Страница 450: ...438 Using Variables ...
Страница 602: ...590 Using Lists Spreadsheet ...
Страница 676: ...664 Using Notes You can also change the sample size and restart the sampling ...
Страница 684: ...672 Libraries ...
Страница 714: ...702 Programming ...
Страница 828: ...816 Data Collection and Analysis ...
Страница 846: ...834 Regulatory Information ...
Страница 848: ...836 ...


