Data Collection and Analysis
755
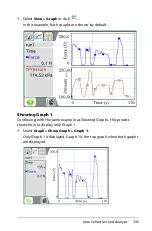
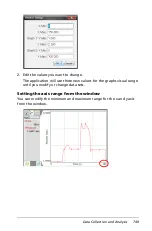
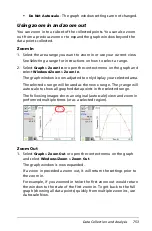
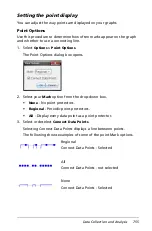
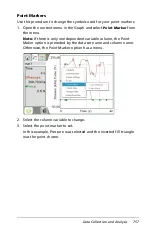
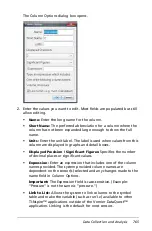
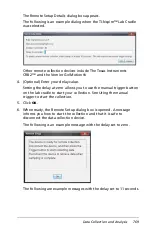
Setting the point display
You can adjust the way points are displayed on your graphs.
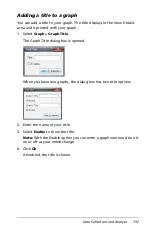
Point Options
Use this procedure to determine how often marks appear on the graph
and whether to use a connecting line.
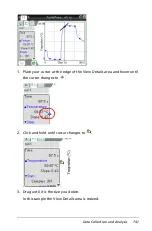
1. Select
Options > Point Options
.
The Point Options dialog box opens.
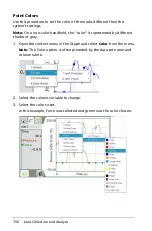
2. Select your
Mark
option from the drop-down box.
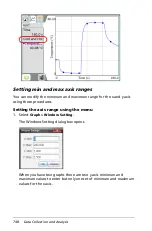
•
None
- No point protectors.
•
Regional
- Periodic point protectors.
•
All
- Display every data point as a point protector.
3. Select or deselect
Connect Data Points
.
Selecting Connect Data Points displays a line between points.
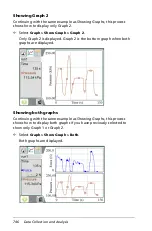
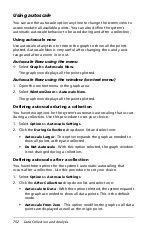
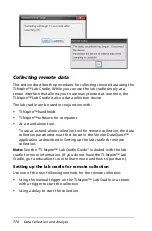
The following shows examples of some of the point Mark options.
Regional
Connect Data Points - Selected
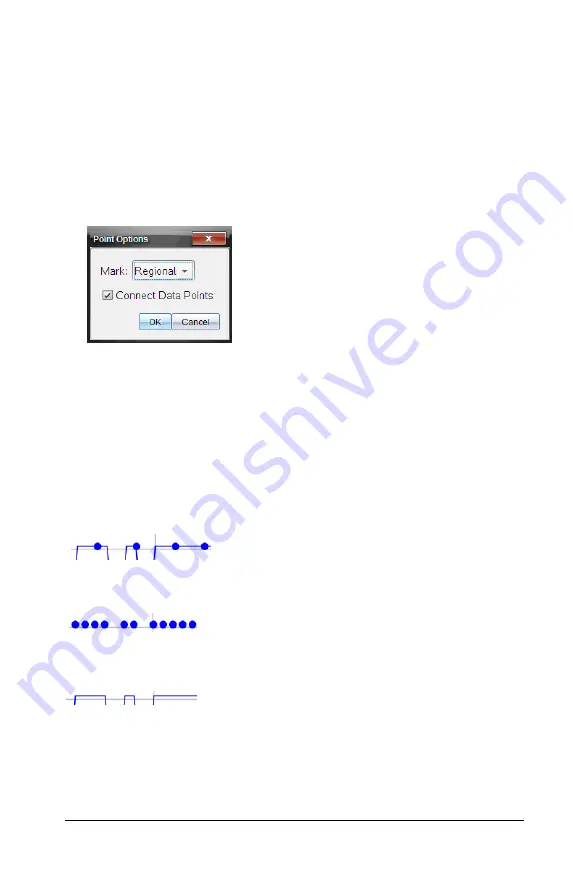
All
Connect Data Points - not selected
None
Connect Data Points - Selected
Содержание TI-Nspire
Страница 38: ...26 Setting up the TI Nspire Navigator Teacher Software ...
Страница 46: ...34 Getting started with the TI Nspire Navigator Teacher Software ...
Страница 84: ...72 Using the Content Workspace ...
Страница 180: ...168 Capturing Screens ...
Страница 256: ...244 Embedding documents in web pages ...
Страница 332: ...320 Polling students For detailed information on viewing and sorting poll results see Using the Review Workspace ...
Страница 336: ...324 Polling students ...
Страница 374: ...362 Using the Review Workspace ...
Страница 436: ...424 Calculator ...
Страница 450: ...438 Using Variables ...
Страница 602: ...590 Using Lists Spreadsheet ...
Страница 676: ...664 Using Notes You can also change the sample size and restart the sampling ...
Страница 684: ...672 Libraries ...
Страница 714: ...702 Programming ...
Страница 828: ...816 Data Collection and Analysis ...
Страница 846: ...834 Regulatory Information ...
Страница 848: ...836 ...


