642
Using Data & Statistics
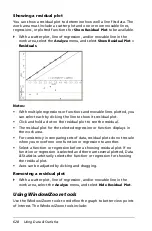
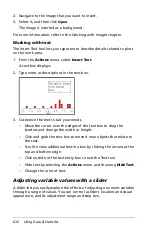
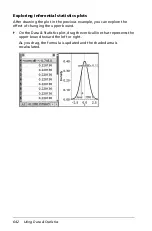
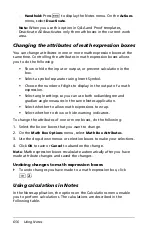
Exploring inferential statistics plots
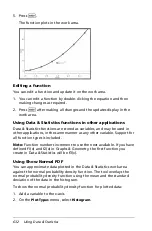
After drawing the plot in the previous example, you can explore the
effect of changing the upper bound.
`
On the Data & Statistics plot, drag the vertical line that represents the
upper bound toward the left or right.
As you drag, the formula is updated and the shaded area is
recalculated.
Содержание TI-Nspire
Страница 38: ...26 Setting up the TI Nspire Navigator Teacher Software ...
Страница 46: ...34 Getting started with the TI Nspire Navigator Teacher Software ...
Страница 84: ...72 Using the Content Workspace ...
Страница 180: ...168 Capturing Screens ...
Страница 256: ...244 Embedding documents in web pages ...
Страница 332: ...320 Polling students For detailed information on viewing and sorting poll results see Using the Review Workspace ...
Страница 336: ...324 Polling students ...
Страница 374: ...362 Using the Review Workspace ...
Страница 436: ...424 Calculator ...
Страница 450: ...438 Using Variables ...
Страница 602: ...590 Using Lists Spreadsheet ...
Страница 676: ...664 Using Notes You can also change the sample size and restart the sampling ...
Страница 684: ...672 Libraries ...
Страница 714: ...702 Programming ...
Страница 828: ...816 Data Collection and Analysis ...
Страница 846: ...834 Regulatory Information ...
Страница 848: ...836 ...


