

334
Using the Review Workspace
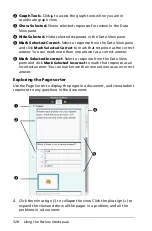
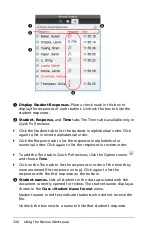
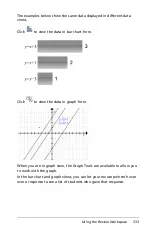
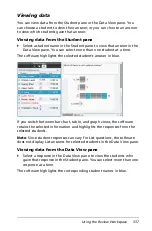
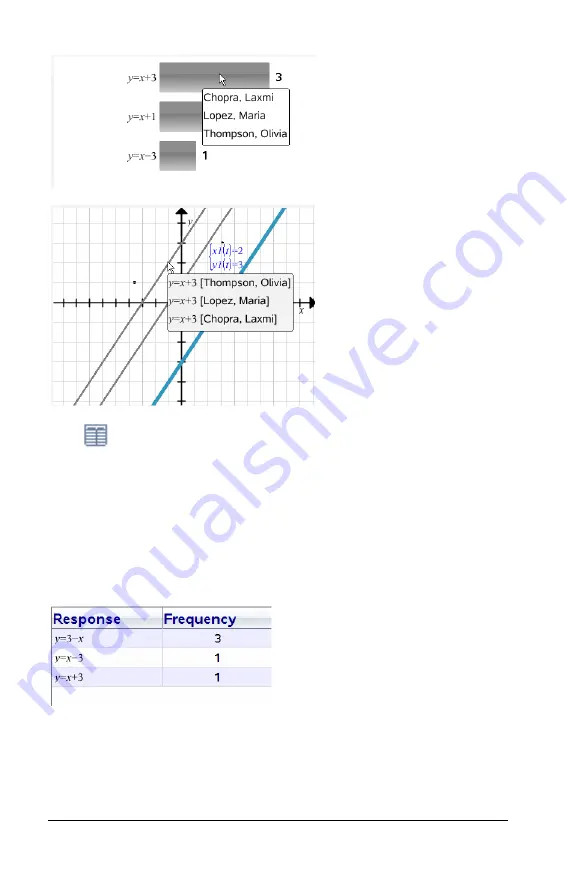
Click
to view the data in table form.
The table view is available as a frequency table or as a student table.
`
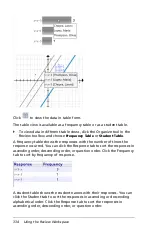
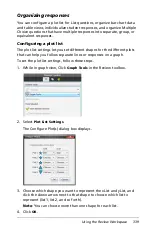
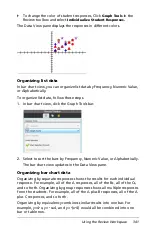
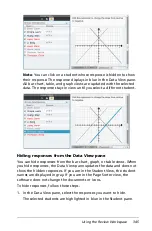
To view data in different table views, click the Organize tool in the
Review toolbox and choose
Frequency Table
or
Student Table
.
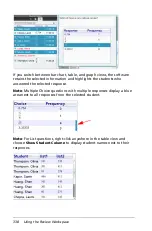
A frequency table shows the responses with the number of times the
response occurred. You can click the Response tab to sort the responses in
ascending order, descending order, or question order. Click the Frequency
tab to sort by frequency of response.
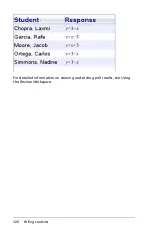
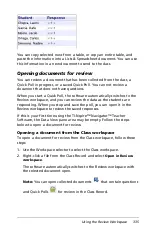
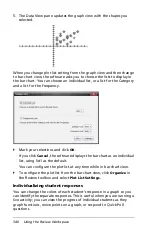
A student table shows the student names with their responses. You can
click the Student tab to sort the responses in ascending or descending
alphabetical order. Click the Response tab to sort the responses in
ascending order, descending order, or question order.
Содержание TI-Nspire
Страница 38: ...26 Setting up the TI Nspire Navigator Teacher Software ...
Страница 46: ...34 Getting started with the TI Nspire Navigator Teacher Software ...
Страница 84: ...72 Using the Content Workspace ...
Страница 180: ...168 Capturing Screens ...
Страница 256: ...244 Embedding documents in web pages ...
Страница 332: ...320 Polling students For detailed information on viewing and sorting poll results see Using the Review Workspace ...
Страница 336: ...324 Polling students ...
Страница 374: ...362 Using the Review Workspace ...
Страница 436: ...424 Calculator ...
Страница 450: ...438 Using Variables ...
Страница 602: ...590 Using Lists Spreadsheet ...
Страница 676: ...664 Using Notes You can also change the sample size and restart the sampling ...
Страница 684: ...672 Libraries ...
Страница 714: ...702 Programming ...
Страница 828: ...816 Data Collection and Analysis ...
Страница 846: ...834 Regulatory Information ...
Страница 848: ...836 ...


