


470
Graphs & Geometry
–
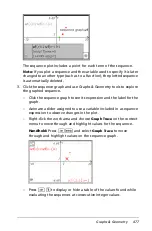
Create a persistent point that remains on the graph while in
Graph Trace mode by pressing
·
when the trace point reaches
the point you want to label.
–
Trace through and identify the points at which the graph has no
defined value (a discontinuity) for a coordinate. The coordinate
pair (x, undef) displays when you trace a point with an undefined
x coordinate.
Notes:
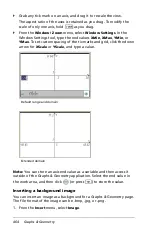
–
When you select or trace a graph or plot on the work area, that
relation displays on the entry line.
–
When you trace beyond the initially visible graph, the screen pans
to show the area being traced.
4. Exit Graph Trace by pressing
d
or by choosing another tool.
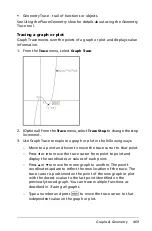
Tracing all graphs
The Trace All tool works like Graph Trace, but allows tracing multiple
functions simultaneously. With several functions graphed on the work
area, perform the following steps:
Note:
The Trace All tool traces only function graphs, not plots of other
relations (polar, parametric, scatter, sequence).
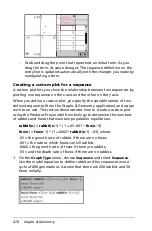
1. Choose
Trace All
from the
Trace
menu.
A vertical line indicates the x value of the trace and a trace point
appears on each function graphed on the work area.
2. Press
7
or
8
to move the trace point along each graph on the work
area simultaneously.
3. Exit Trace All by pressing
d
or by choosing another tool.
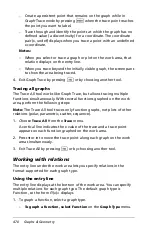
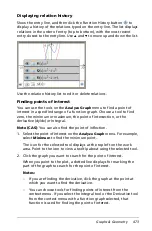
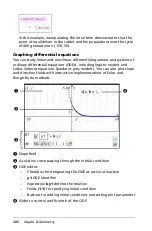
Working with relations
The entry line under the work area lets you specify relations in the
format supported for each graph type.
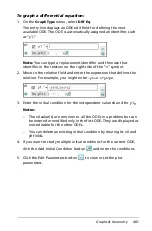
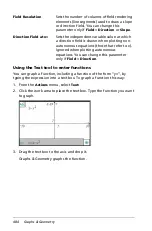
Using the entry line
The entry line displays at the bottom of the work area. You can specify
multiple relations for each graph type. The default graph type is
Function, so the form
f1
(
x
)= displays.
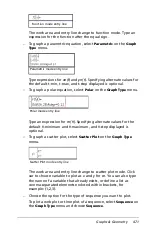
1. To graph a function, select a graph type.
–
To graph a function, select Function
on the
Graph Type
menu.
Содержание TI-Nspire
Страница 38: ...26 Setting up the TI Nspire Navigator Teacher Software ...
Страница 46: ...34 Getting started with the TI Nspire Navigator Teacher Software ...
Страница 84: ...72 Using the Content Workspace ...
Страница 180: ...168 Capturing Screens ...
Страница 256: ...244 Embedding documents in web pages ...
Страница 332: ...320 Polling students For detailed information on viewing and sorting poll results see Using the Review Workspace ...
Страница 336: ...324 Polling students ...
Страница 374: ...362 Using the Review Workspace ...
Страница 436: ...424 Calculator ...
Страница 450: ...438 Using Variables ...
Страница 602: ...590 Using Lists Spreadsheet ...
Страница 676: ...664 Using Notes You can also change the sample size and restart the sampling ...
Страница 684: ...672 Libraries ...
Страница 714: ...702 Programming ...
Страница 828: ...816 Data Collection and Analysis ...
Страница 846: ...834 Regulatory Information ...
Страница 848: ...836 ...


