

Using Data & Statistics
597
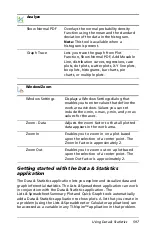
Getting started with the Data & Statistics
application
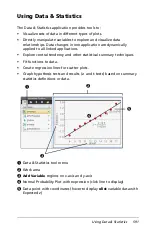
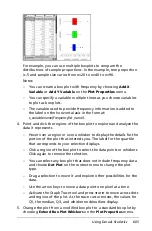
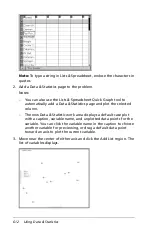
The Data & Statistics application lets you explore and visualize data and
graph inferential statistics. The Lists & Spreadsheet application can work
in conjunction with the Data & Statistics application. The
Lists & Spreadsheet Summary Plot and Quick Graph tools automatically
add a Data & Statistics application
to show plots.
A list that you create in
a problem (using the Lists & Spreadsheet or Calculator applications) can
be accessed as a variable in any TI-Nspire™ application in that problem.
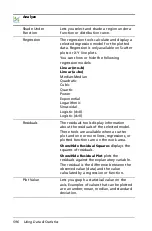
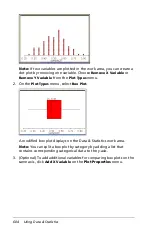
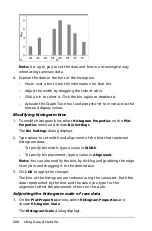
Show Normal PDF
Overlays the normal probability density
function using the mean and the standard
deviation of the data in the histogram.
Note:
This tool is available when a
histogram is present.
Graph Trace
Lets you trace the graph from Plot
Function, Show Normal PDF, Add Movable
Line, distribution curves, regressions, case
plots, dot plots, scatter plots, X-Y line plots,
box plots, histograms, bar charts, pie
charts, or multiple plots.
Window/Zoom
Window Settings
Displays a Window Settings dialog that
enables you to enter values that define the
work area window. Values you can set
include the
x
-min,
x
-max,
y
-min, and
y
-max
values for the axes.
Zoom - Data
Adjusts the zoom factor so that all plotted
data appears in the work area.
Zoom In
Enables you to zoom in on a plot based
upon the selection of a center point. The
Zoom In factor is approximately 2.
Zoom Out
Enables you to zoom out on a plot based
upon the selection of a center point. The
Zoom Out factor is approximately 2.
Analyze
Содержание TI-Nspire
Страница 38: ...26 Setting up the TI Nspire Navigator Teacher Software ...
Страница 46: ...34 Getting started with the TI Nspire Navigator Teacher Software ...
Страница 84: ...72 Using the Content Workspace ...
Страница 180: ...168 Capturing Screens ...
Страница 256: ...244 Embedding documents in web pages ...
Страница 332: ...320 Polling students For detailed information on viewing and sorting poll results see Using the Review Workspace ...
Страница 336: ...324 Polling students ...
Страница 374: ...362 Using the Review Workspace ...
Страница 436: ...424 Calculator ...
Страница 450: ...438 Using Variables ...
Страница 602: ...590 Using Lists Spreadsheet ...
Страница 676: ...664 Using Notes You can also change the sample size and restart the sampling ...
Страница 684: ...672 Libraries ...
Страница 714: ...702 Programming ...
Страница 828: ...816 Data Collection and Analysis ...
Страница 846: ...834 Regulatory Information ...
Страница 848: ...836 ...


