
Using Data & Statistics
605
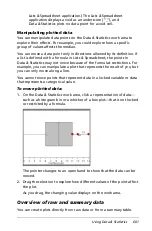
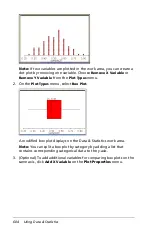
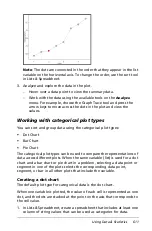
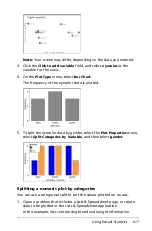
For example, you can use multiple boxplots to compare the
distributions of sample proportions. In the example, true proportion
is .5 and sample size varies from n=20 to n=40 to n=90.
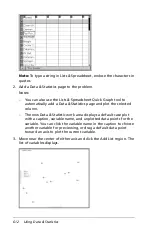
Notes:
–
You can create a box plot with frequency by choosing
Add X
Variable
or
Add Y Variable
on the
Plot Properties
menu.
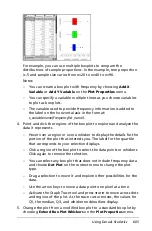
–
You can specify a variable multiple times as you choose variables
to plot as box plots.
–
The variable used to provide frequency information is added to
the label on the horizontal axis in the format:
x_variablename{frequencylist_name}.
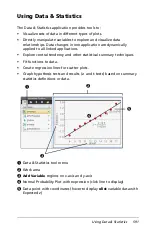
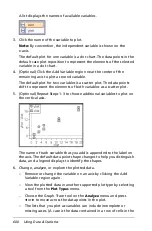
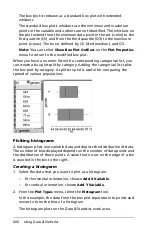
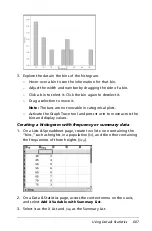
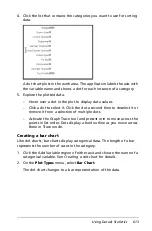
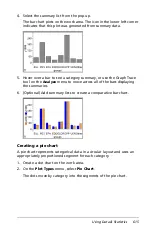
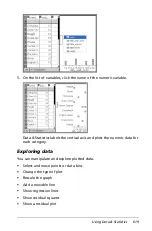
4. Point and click the regions of the box plot to explore and analyze the
data it represents.
–
Hover over a region or over a whisker to display the details for the
portion of the plot that interests you. The label for the quartile
that corresponds to your selection displays.
–
Click a region of the box plot to select the data points or whiskers.
Click again to remove the selection.
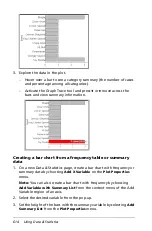
–
You can select any box plot that does not include frequency data
and choose
Dot Plot
on the context menu to change the plot
type.
–
Drag a selection to move it and explore other possibilities for the
data.
–
Use the arrow keys to move a data point one pixel at a time.
–
Activate the Graph Trace tool and press
7
or
8
to move across dots
and regions of the plot. As the trace cursor moves, the values for
Q1, the median, Q3, and whisker ends/outliers display.
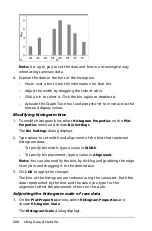
5. Change the plot from a modified box plot to a standard box plot by
choosing
Extend Box Plot Whiskers
on the
Plot Properties
menu.
Содержание TI-Nspire
Страница 38: ...26 Setting up the TI Nspire Navigator Teacher Software ...
Страница 46: ...34 Getting started with the TI Nspire Navigator Teacher Software ...
Страница 84: ...72 Using the Content Workspace ...
Страница 180: ...168 Capturing Screens ...
Страница 256: ...244 Embedding documents in web pages ...
Страница 332: ...320 Polling students For detailed information on viewing and sorting poll results see Using the Review Workspace ...
Страница 336: ...324 Polling students ...
Страница 374: ...362 Using the Review Workspace ...
Страница 436: ...424 Calculator ...
Страница 450: ...438 Using Variables ...
Страница 602: ...590 Using Lists Spreadsheet ...
Страница 676: ...664 Using Notes You can also change the sample size and restart the sampling ...
Страница 684: ...672 Libraries ...
Страница 714: ...702 Programming ...
Страница 828: ...816 Data Collection and Analysis ...
Страница 846: ...834 Regulatory Information ...
Страница 848: ...836 ...


