Hioki MR8740 Скачать руководство пользователя страница 42

1.5  Basic Operations

30

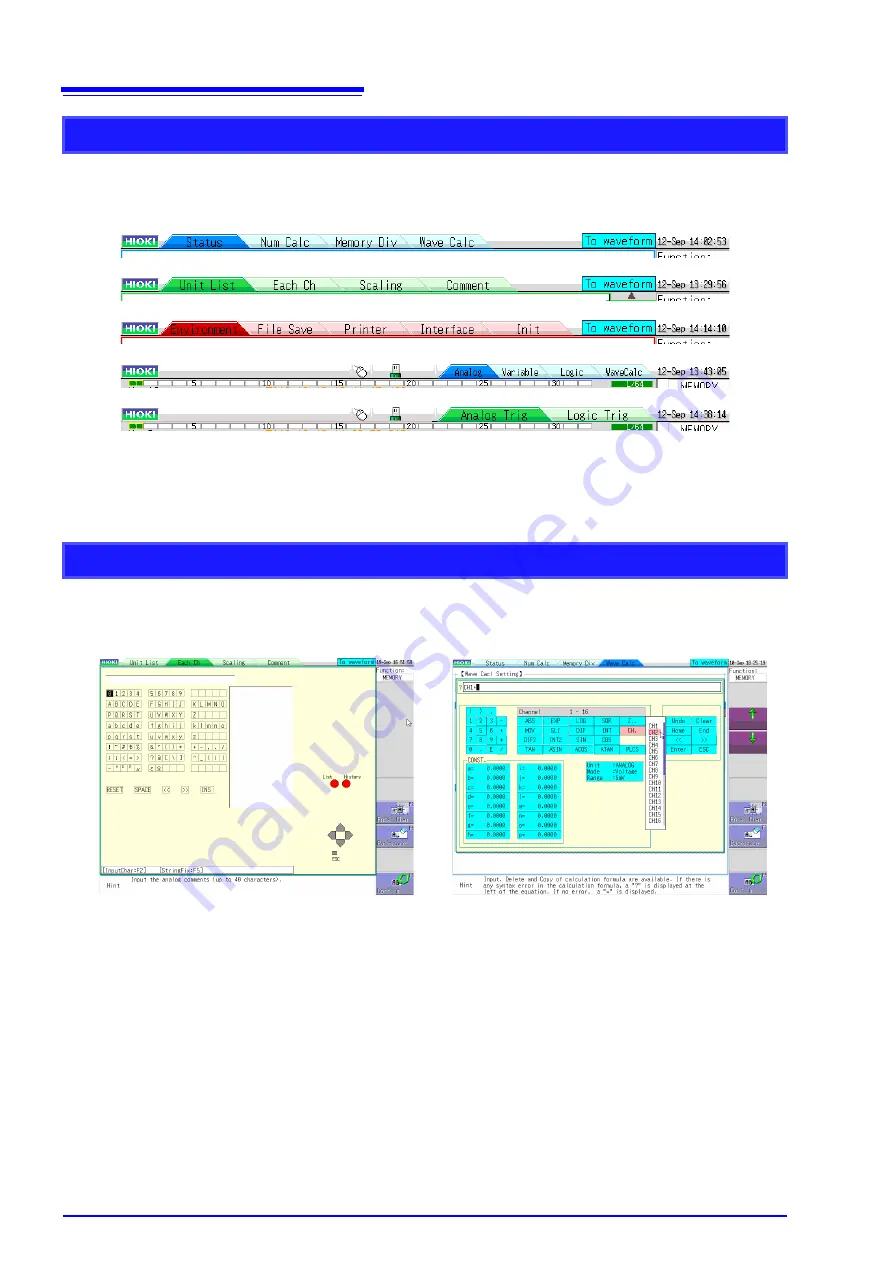
When settings are split into multiple pages, you can change the settings screen directly by clicking
the displayed tabs.

With the tabs of the Waveform screen, clicking the currently selected tab again changes the dis-
played channel.

The menus displayed when inputting comments and calculation equations allow direct character
input with click operations.

Changing Pages on a Settings Screen

Character Input

Содержание MR8740

Страница 1: ...MR8740 MR8741 Instruction Manual MEMORY HiCORDER EN Oct 2018 Revised edition 7 MR8740A982 07 18 10H ...

Страница 2: ......

Страница 3: ...s 29 1 5 4 Mouse Wheel Operations 31 1 5 5 Waveform Operations 32 1 5 6 Measurement Operations 33 1 5 7 File Operations 34 Chapter 2 Measurement Preparations_______________________________ 35 2 1 Install an input module 36 2 2 Connecting Cords 39 2 3 Recording Media Preparation 52 2 3 1 Storage Media Inserting a USB Memory Stick 52 2 3 2 Formatting Storage Media 53 2 4 Supplying Power 54 2 4 1 Con...

Страница 4: ... Sheet 78 3 6 Starting and Stopping Measurement 79 Chapter 4 Saving Loading Data Managing Files ___________________________81 4 1 Data capable of Being Saved Loaded 83 4 2 Saving Data 85 4 2 1 Save Types and Workflow 85 4 2 2 Automatically Saving Waveforms 86 4 2 3 Saving Data Selectively SAVE 91 4 2 4 Saving Example Saving for Memory Division 94 4 2 5 Save Waveform Output Data to the Media 96 4 3...

Страница 5: ...ent Waveform 123 6 3 3 Moving the Position 124 6 4 Performing Waveform X Y Synthesis 125 6 5 Magnifying and Compressing Waveforms 127 6 5 1 Magnifying and Compressing Horizontal Axis Time Axis 127 6 5 2 Zoom Function Magnifying a Section of the Horizontal Axis Time Axis 128 6 5 3 Magnifying and Compressing Vertical Axis Voltage Axis 129 6 6 Monitoring Input Levels Level Monitor 130 6 6 1 Level Mon...

Страница 6: ... for the Anti Aliasing Filter A A F 8968 High Resolution Unit 160 7 9 2 Probe Attenuation Selection 160 7 9 3 Settings for the 8967 TEMP Unit 161 7 9 4 Settings for the 8969 and U8969 Strain Unit 163 7 9 5 Settings for the 8970 Freq Unit 164 7 9 6 Settings for the 8971 Current Unit 167 7 9 7 Settings for the 8972 DC RMS Unit 168 7 9 8 Settings for the MR8990 Digital Voltmeter Unit 169 7 9 9 Model ...

Страница 7: ...Sources 204 8 12 Using trigger settings to search measurement data 205 Chapter 9 Numerical Calculation Functions ________________________________ 207 9 1 Numerical Calculation Workflow 208 9 2 Settings for Numerical Value Calculation 210 9 2 1 Displaying Numerical Calculation Results 213 9 3 Judging Calculation Results 214 9 3 1 Display of Judgment Results and Signal Output 216 9 4 Saving Numerica...

Страница 8: ...Out and Calculating Data 249 12 3 5 Setting the Window Function 250 12 3 6 Setting Peak Values of Analysis Results 251 12 3 7 Averaging Waveforms 252 12 3 8 Emphasizing Analysis Results phase spectra only 255 12 3 9 Analysis Mode Settings 256 12 3 10Setting the Display Range of the Vertical Axis Scaling 260 12 3 11Setting and Changing Analysis Conditions on the Waveform Screen 261 12 4 Selecting C...

Страница 9: ...AN Settings at the Instrument 310 15 1 2 Connecting Instrument and PC With LAN Cable 314 15 2 Performing Remote Operations on the Instrument Use an Internet Browser 316 15 2 1 Making HTTP Settings on the Instrument 316 15 2 2 Connecting to the Instrument With an Internet Browser 317 15 2 3 Operating the Instrument With an Internet Browser 318 15 3 Accessing the Files on the Instrument From a Compu...

Страница 10: ...ecifications 341 17 2 Measurement Functions 343 17 2 1 Memory Function 343 17 2 2 Recorder Function 343 17 2 3 FFT Function 343 17 3 Trigger Section 344 17 4 File Specifications 345 17 5 Built In Functions 346 17 6 Input Modules Specifications 349 17 6 1 8966 Analog Unit 349 17 6 2 8967 TEMP Unit 350 17 6 3 8968 High Resolution Unit 351 17 6 4 8969 Strain Unit U8969 Strain Unit 352 17 6 5 8970 Fre...

Страница 11: ...ent Lithium Battery Removal 377 Appendix________________________________ A 1 Appendix 1 Default Values for Major Settings A 1 Appendix 2 Reference A 2 Appendix 2 1 Waveform File Sizes A 2 Appendix 2 2 Setting Configuration and Image Data File Sizes A 5 Appendix 2 3 Timebase and Maximum Recordable Time A 6 Appendix 2 4 Maximum record length and number of divisions Memory division function A 7 Appen...

Страница 12: ...Contents x ...

Страница 13: ...als p 185 Applying a Manual Trigger p 199 Adding Comments p 136 Freely Setting the Waveform Display p 71 Converting Input Values p 146 Copying Settings to Other Channels p 158 Suppressing Noise Low pass filter p 76 Composing X Y Waveforms p 125 Scaling During Measurement Using a Current Clamp p 148 Basic Workflow p 35 p 59 p 79 p 54 p 117 Connect the cords Install the input modules Install the rec...

Страница 14: ... it carefully to ensure that no damage occurred during shipping In particular check the accessories panel switches and connectors If damage is evident or if it fails to operate according to the specifications contact your dealer or Hioki representative Introduction Confirming Package Contents Confirm that these contents are provided One each Instruction Manual Application disc 1 p 327 SF8000 Wavef...

Страница 15: ...strument a person familiar with such instruments must supervise operations This instrument is measured on a live line Wear the insulating protective gear according to the regulation to avoid electric shocks Symbols Affixed to the Instrument Indicates that incorrect operation presents an extreme hazard that could result in serious injury or death to the user Indicates that incorrect operation prese...

Страница 16: ... Electronic Equipment Directive WEEE Directive in EU member states Indicates that the product conforms to regulations set out by the EC Directive Notation Indicates the prohibited action p Indicates the location of reference information Indicates quick references for operation and remedies for troubleshoot ing Indicates that descriptive information is provided below Menus commands dialogs buttons ...

Страница 17: ...osition Activate Click on a screen to activate that screen Accuracy We define measurement tolerances in terms of f s full scale values with the following meanings f s maximum display value or scale length The maximum displayable value or scale length In this instrument the maxi mum displayable value is the range V div times the number of divisions 20 on the vertical axis Example For the 1 V div ra...

Страница 18: ...el and feed ers from the distribution panel to outlets CAT IV When measuring the circuit from the service drop to the service entrance and to the power meter and primary overcurrent protection device distribution panel Measurement categories Using a measuring instrument in an environment designated with a higher numbered category than that for which the instrument is rated could result in severe a...

Страница 19: ... result in electric shock Replace the connection cable with those specified by our company Verify that it operates normally to ensure that no damage occurred during stor age or shipping If you find any damage contact your authorized Hioki distribu tor or reseller Instrument Installation Installing the instrument in inappropriate locations may cause a malfunction of instrument or may give rise to a...

Страница 20: ...a module install a blank panel over the opening of the removed module To prevent instrument damage or electric shocks use only the screws for securing the module in place that shipped with the instrument If you lose any screw or find that any screws are damaged please contact your Hioki distributor for a replacement To avoid damage to the instrument protect it from physical shock when trans portin...

Страница 21: ...a USB memory stick is connected Dam age could result Some USB memory sticks are susceptible to static electricity Exercise care when using such products because static electricity could damage the USB memory stick or cause malfunction of the instrument With some USB devices the instrument may not start up if power is turned on while the device is inserted to the USB port In such a case turn power ...

Страница 22: ...ips To avoid electrical shocks be careful to avoid shorting live lines with the con nection cable clips To avoid electric shock and short circuit accidents use only the specified test leads to connect the instrument input terminals to the circuit to be tested To prevent an electric shock confirm that the white or red portion insulation layer inside the cable is not exposed If a color inside the ca...

Страница 23: ... the following connection pro cedure Measurement Object Memory HiCorder Logic probe Connect this instrument to the same outlet as the measurement object us ing the supplied grounding polar ized power cord ground to the GND terminal functional earth terminal of this instrument Always obtain power from the same mains circuit Measurement Object Logic probe Functional Earth Termi nals GND Memory HiCor...

Страница 24: ...isolated The ground pins of external control connectors are not isolated from the instru ment s ground Connect so that no potential difference arise between external con trol connector ground and the ground of the connection object Failure to observe this precaution can result in damage to the connection object and the instrument Use a common ground for both the instrument and the connection equip...

Страница 25: ...discs inside a protective case and do not expose to direct sunlight high temperatures or high humidity Hioki is not liable for any issues your computer system experiences in the course of using this disc Precautions During Shipment Keep the packing material that was used for shipping this instrument because you may need to use it when transporting the instrument in the future ...

Страница 26: ...Operating Precautions 14 ...

Страница 27: ...toring and inspection lines The product offers the following features Overview Chapter 1 1 1 Product Overview Simultaneous multi chan nel measurement Measure up to 54 analog channels Ideal for mounting in a rack Height 4U 178 mm or less All channels isolated High speed sampling 20 MS s Enables responsive evaluation and analysis MR8740 MR8741 Multi channel waveform genera tion ...

Страница 28: ...d power cord here p 54 POWER Switch Turns the instru ment on and off Power On Power Off p 55 100BASE TX Connector Connect LAN cables here p 309 DVI D Connectors Connect an LCD monitor here Standard LOGIC Terminals Input connectors for optional logic probes p 39 USB Connector Type A Connect USB memory sticks here p 52 Power Indicator Lit when the instru ment is on USB Connector Type A Connect USB m...

Страница 29: ...u ment is on DVI D Connector Connect an LCD monitor here USB Connector Type A Connect USB memory sticks here p 52 Manufacturer s Serial No Shows the serial number Do not remove this label as it is required for product support POWER Switch Turns the instrument on and off Power On Power Off p 55 Power Inlet Connect the supplied power cord here p 54 Ventilation Holes Fan Make sure the ventilation hol...

Страница 30: ...t ratio for DVI output with this instrument is 4 3 If you use a wide LCD 16 9 display will be stretched in the horizontal direction External interference may cause display to be distorted Keep the LCD and LCD cable as far away as possible from sources of interference MR8740 displays the waveforms of the block I side 32 analog channels 8 logic channels with DVI I and the waveforms of the block II s...

Страница 31: ...the measurement parameters Trigger Settings Window Channel Settings Window This window is for making the advanced settings for triggers This window is for making the advanced settings for analog channels and logic channels Channel Screen This screen is for making channel settings scaling settings and comment settings There are the following sheets Unit List sheet Each Ch sheet Scaling sheet Commen...

Страница 32: ...et the measurement pa rameters here p 63 Trigger time Shows the date and time of the last trig ger event p 185 Vertical axis display Shows the value per increment for each channel This is linked to the vertical axis voltage axis range setting p 74 Upper and lower limits The upper and lower limit values for each channel are shown here p 132 Scroll bar The stored waveform is indicated by a red bar a...

Страница 33: ... names of sheets that can be selected Click a tab to switch to the corresponding sheet Hint Shows an explanation about the item where the settings cursor is currently located Messages such as Online and error messages are also shown here Next Page This is shown if there are more than six se lection items Selecting this button displays the other items ...

Страница 34: ...as possible from sources of interference Do not use a USB hub because mouse operation may not be possible Also do not connect two mice Right click Displays a menu with a list of screens Grayed out screens cannot be dis played Center wheel Changes the selected item On the File screen you can use the center wheel to change the selected file When measuring with memory division you can use the center ...

Страница 35: ... 1 5 2 Mouse Right click Menu DISP 1 Waveform screen Click DISP to display the Waveform screen If the Waveform screen is already displayed the GUI menu on the right of the screen changes each time you click this item Alternatively you can change the GUI menu on the right of the screen when the Waveform screen is displayed by click ing the DISP icon on the bottom right 1 ...

Страница 36: ...een to switch screens 3 Display range 1 2 Displays the screen for setting the waveform dis play range of the analog unit 2 Analog channel 1 2 Displays the screen for setting the display position etc by setting the range for the analog unit 5 Waveform calculation Displays the screen for changing the display posi tion or color of the calculation waveform when waveform calculation is set to ON 4 Logi...

Страница 37: ...ches between screens 1 to 3 Alternatively you can click the TRIG SET icon on the bottom right of the Waveform display screen to switch screens 3 Logic trigger Displays the screen for setting the waveform dis play range of the logic channel 2 Analog trigger 1 2 Displays the screen for setting the trigger criteria of the analog unit 1 2 3 ...

Страница 38: ...c items for measurement such as the time axis range 4 Waveform calculation Displays the screen for setting the application and analysis of addition subtraction multiplication division and other numerical calculations for waveform data 3 Memory division Displays the screen for setting the measurement of waveform data using the internal memory of the instrument divided 1 2 3 4 ...

Страница 39: ...ach unit 1 Unit list Displays a list of plug in units inserted into the instrument and their settings 4 Comments Displays the screen for setting a comment for each measurement channel 3 Scaling Displays the screen for setting the conversion of measurement values using linear functions 1 2 3 4 ...

Страница 40: ...onment of the instrument 2 File save Displays the screen for setting the method for sav ing measurement data 4 Initialization Displays the screen for clearing the settings of the instrument setting the time etc 3 Interface Displays the screen for the LAN communication setting conditions 1 2 2 2 3 2 4 ...

Страница 41: ...ft click Operations Operations on a Settings Screen Clicking a setting When clicked the setting becomes selected the frame changes color and the setting flashes Selecting a setting value from the GUI on the right of the screen You can change the setting by moving the mouse cursor to a selection item on the right of the screen and then clicking The number of selection items differs depending on the...

Страница 42: ...by clicking the displayed tabs With the tabs of the Waveform screen clicking the currently selected tab again changes the dis played channel The menus displayed when inputting comments and calculation equations allow direct character input with click operations Changing Pages on a Settings Screen Character Input ...

Страница 43: ...of a menu that has a scroll bar displayed For details on wheel operation on the Waveform screen refer to the next page 1 5 4 Mouse Wheel Operations Selecting from a list menu For a setting with a selection item list displayed on the top right of the screen you can use the wheel to change the setting item Scrolling a displayed list You can use the wheel to scroll up and down a list ...

Страница 44: ...ht while holding down the left mouse button dragging You can rotate the wheel button forward or backward to move the A B cursors one sample at a time Click the AB CSR icon on the top right of the Wave form display screen beforehand When the A B cursors are in the Waveform screen you can move the A or B cursor if you left click the A or B mark Changing the displayed block When the memory is divided...

Страница 45: ...ick START to start measurement Stopping measurement Click STOP to stop measurement Triggering manually When the instrument is in a measuring state you can click MANUAL TRIG to apply a trigger manually You can also start and stop measurement as described below START Press the right mouse button drag right and then release the button STOP Press the right mouse button drag left and then release the b...

Страница 46: ...er double click the folder to which you want to move To move to the folder one layer up click the folder path part Scrolling a file list Click the bar on the right side of the screen to scroll a list You can also scroll the list one item at a time by rotating the wheel button forward or backward Selecting the file to load If you double click the list you can select the file to load ...

Страница 47: ...nput module When measuring analog signals p 39 Probes and cables will differ depending on the measurement purpose 5 Connect an LCD monitor p 18 6 Insert media USB memory stick p 52 7 Connect the power cord p 54 8 Turn the power on p 55 9 Setting the clock p 56 10 Perform zero adjust p 57 When preparations are complete let s start a measurement p 59 Using communication functions See Chapter 15 Conn...

Страница 48: ...n this instrument Measurements made without a blank panel installed may fail to meet specifica tions because of temperature instability within the instrument For information on analog channel accuracy when using logic channels see 7 9 Making Detailed Settings for Input Modules p 159 Required item One Phillips head screwdriver 1 Turn the instrument s POWER switch Off 2 With attention to the orienta...

Страница 49: ...nstalled may fail to meet specifications because of temperature instability within the instrument Front Side Using the Phillips screwdriver tighten the two mount ing screws If not installing another input module after removal Analog channels only Block I Block II LA LB LA LB 1 4 1 4 1 4 1 4 Mix including logic units L7A L7B L7C L7D 1 4 1 4 1 4 1 4 Install the logic units at the module 1 to module ...

Страница 50: ...nd the channel numbers are in order starting with one at the bottom of the module at the very left Analog channels only Ch1 Ch2 LA LB LC LD 1 4 1 4 1 4 1 4 Module 1 Module 2 Module 3 Module 4 Module 5 Module 6 Module 7 Module 8 Mix including logic units Ch3 Ch4 Ch15 Ch16 L7A L7B L7C L7D 1 4 1 4 1 4 1 4 ...

Страница 51: ...ximum input voltage 300 V Small alligator clip type L9217 Connection Cord Maximum input voltage 300 V For measuring BNC output IModel L9790 Connection Cord Maximum input voltage 600 V Terminal type Alligator contact grabber Example Terminal type Alligator IIf the voltage to be measured exceeds the maximum input rating of the module being used Model 9322 Differential Probe 1 Model 9665 10 1 Probe M...

Страница 52: ...surement object Connecting the cable 1 Connect the BNC plug on the cable to a BNC jack on the input module 2 Align the slots in the BNC plug with the guide pins on the jack on the input module then push and twist the plug clockwise until it locks 3 Connect the cable clips to the mea surement object Disconnecting BNC connectors Push the BNC plug twist it counter clockwise and pull it out ...

Страница 53: ...oltage 600 V Terminal type Alligator contact grabber Example Terminal type Alligator IIf the voltage to be measured exceeds the maximum input rating of the module being used Model 9322 Differential Probe 1 Model 9665 10 1 Probe Model 9666 100 1 Probe Model P9000 01 02 Differential Probe 2 Example Model P9000 02 Differential Probe Measuring Frequency Number of Rotations and Count Connect to the BNC...

Страница 54: ...de of a flat screwdriver into the button on the terminal block of the input module 3 Insert each thermocouple wire into the appropriate terminal hole while press ing the button Confirm proper polarity 4 Release the button The thermocouple is connected 5 Attach to the measurement object To remove the thermocouple Hold the button while pulling the ther mocouple wire out Required item Thermocouple Fe...

Страница 55: ...ector until they are locked together 3 Connect Model L9769 to the strain gauge transducer 4 Connect the strain gauge transducer to a measurement object Example Connecting the strain gauge transducer to Model U8969 Strain Unit via Model L9769 Con version Cable Required items Model L9769 Conversion Cable strain gauge trans ducer Connect to input module s terminal Connect Model L9769 to the strain ga...

Страница 56: ... top side is facing up Pin No Description 1 BRIDGE 2 SENSE 3 INPUT 4 INPUT 5 BRIDGE 6 SENSE 7 FLOATING COMMON Pin Mark Description A BRIDGE B INPUT C BRIDGE D INPUT E FLOATING COMMON F G N C 1 2 3 4 5 6 7 Preforming measurement with a strain gauge requires a bridge box Use a strain gauge and bridge box both of which are commercially available The bridge box may be susceptible to the effect of nois...

Страница 57: ...o the input module jack 8971 Current Unit cannot be used with MR8741 With MR8740 up to four 8971 Current Units can be used 1 Align the grooves of the unit sensor connector and the conversion cable plug Insert the plug until it locks 2 Align the grooves of the conversion cable connector and the plug of the clamp on sensor to be used Insert the plug until it locks 3 Connect the clamp sensor to the i...

Страница 58: ...ecting a Logic Probe to the Measurement Object p 11 carefully For more information about logic probe specifications see the instruction manual that came with the logic probe you plan to us Connect to the measurement object MR8740 Front Side Example Connecting the 9327 Logic Probe 1 Connect the logic probe by aligning the groves on the plug and a LOGIC terminal 2 Connect to the measurement object R...

Страница 59: ...Voltmeter Connect to the banana jacks on a module 1 Connect the test leads to the banana jacks on the module Connect the black lead to the L jack and the red lead to the H jack Make sure the test lead plugs are fully inserted into the jacks 2 Connect the test leads to the object to be measured Required item Test leads above Banana jacks Connect to banana jacks Connect the leads to the object to be...

Страница 60: ...pplicable Input Modules Model U8974 High Voltage Unit Required item Model L4940 Connection Cable Set Model L4940 Connection Cable Set Maximum input voltage 1000 V High Voltage Measurement Connect to the banana jacks on a module ...

Страница 61: ...s to the mea surement object Required item Model L4940 Connection Cable Set Banana jacks To Connect to banana jacks Connect the clip Connect the Connection cable 2 1 Accessory clips Model L4934 Small Alligator Clip Set Model L4932 is required when using Model L4934 Model L4935 Alligator Clip Set Model 9243 Grabber Clip Model L4936 Bus Bar Clip Set Model L4937 Magnetic Adapter Set Model L4932 Test ...

Страница 62: ...le BNC output 1 Insert the SMB connector of connection cable in the output terminal of the module until you hear a click 2 Connect the cable clips to the object to which the waveform is being applied Required items Connection cable mentioned above Output terminal To Connect to Output Terminals Connect the Connection cable 1 To disconnect output connectors Grip the head of the SMB connector not the...

Страница 63: ...rator Unit Required items Commercially available cable Half pitch 50 pins Output Pulse Waveform 入力ユニットのバナナ端子に接続します 1 Connect the connection cable to Output Connector of module 2 Connect the connection cable to the object to which the waveform is being applied Required items Commercially available cable To Connect to Output Connector Connect the Connection cable 1 To disconnect output connectors Ho...

Страница 64: ...marks and Notes RAM Internal memory Memory integrated in the unit is used Only settings can be stored Automatic saving of data is not possible USB memory stick Inserting a USB memory stick Ensure correct orientation of the USB memory stick and push it all the way into the connector Remove a USB memory stick Verify that the unit is not accessing the USB mem ory stick for saving or loading data etc ...

Страница 65: ...formatting used storage media deletes all the information on the stor age media and that deleted information is unrecoverable Procedure To open the screen Right click and select FILE File screen 1 Insert the storage media 2 Select Next Page Select Format The flashing cursor moves to the Format Target item 3 Select the storage media to format and select Exec The specified storage media is formatted...

Страница 66: ...ly Connect the power cord to MR8740 MR8741 and plug it into an AC outlet 2 4 Supplying Power 2 4 1 Connecting the Power Cord 1 Connect the power cord to the power inlet on the instrument 2 Plug the power cord into the mains outlet Connection Procedure Back Side 2 MR8740 MR8741 ...

Страница 67: ...ovide about 30 minutes warm up after turn ing power on to allow the internal temperature of the input modules to stabilize After that perform zero adjustment before taking measurements Turn the POWER switch off When power is turned on again the display appears with the settings that existed when power was last turned off Turning Power Off Power Off Recording Data When the POWER switch is turned of...

Страница 68: ...cedure To open the screen Right click and select SYSTEM Init sheet 1 Move the flashing cursor to the Clock item 2 Select the digit to change and set the numeric value 3 When you select Apply while the flashing cursor is on the Clock item the clock is set to the current date and time values The date and time indication is shown at the top right of the screen The instrument contains a built in backu...

Страница 69: ... to changes in temperature and due to compo nent aging over a period of use 2 6 Adjusting the Zero Position Zero Adjust To obtain precise measurements provide about 30 minutes warm up after turning power on to allow the internal temperature of the input modules to stabilize Note that zero adjust cannot be performed during a measurement During zero adjust the mouse operation is disabled The procedu...

Страница 70: ...n Mounting MR8990 Before performing this procedure allow the equipment to warm up for about 30 minutes after the power is turned on to enable the internal temperature of the input modules to stabilize Note that calibration cannot be performed during measurement However if the calibration setting is set to ON calibration is performed at the start of measurement Mouse operations are not accepted dur...

Страница 71: ...input Take the connection method into consider ation and make sure that the rating is not exceeded Input module Maximum rated input voltage Maximum rated voltage versus ground 8966 Analog Unit 400 V DC 300 VAC DC CAT II 8967 TEMP Unit 300 VAC DC CAT II 8968 High Resolution Unit 400 V DC 300 VAC DC CAT II 8969 Strain Unit 33 V rms 70 V DC U8969 Strain Unit 30 V rms 60 V DC 8970 Freq Unit 400 V DC 3...

Страница 72: ... Recording Roll Mode p 143 7 3 Displaying New Waveforms Over Past Waveforms Overlay p 144 Chapter 9 Numerical Calculation Functions p 207 3 Input Channel Settings Make analog channel settings Make logic channel settings See 3 5 2 Analog Channel p 74 3 5 3 Logic Channel p 77 Application examples See 7 1 Adding Comments p 136 7 4 Converting Input Values Scaling Function p 146 7 5 Variable Function S...

Страница 73: ...easurement p 79 To reuse previously stored settings Load the settings file from the File screen Saving the settings for different measurement targets or applications enhances operation convenience See 4 3 Loading Data p 97 To return settings to the original basic default condition From the System screen select the Init sheet to return the unit to the factory default settings In this condition the ...

Страница 74: ...n cable to be used damaged or is bare metal exposed When using probes and connection cables When using a clamp Is the clamp cracked or damaged Yes 1 No Metal Exposed 2 Go to No 2 Go to Peripheral Device Inspection If damage is evident request re pairs Yes Is damage to the instrument or input mod ules evident Instrument and Input Module Inspection When turning power on Do the fans rotate and the Hi...

Страница 75: ...g the Settings window Click DISP in the right click menu 3 4 1 Measurement Function Procedure To open the screen Right click and select DISP Waveform screen Move the flashing cursor to the function item topmost field in the settings window Select MEMORY default setting RECORDER FFT This function is most suitable for oscilloscope type measurements such as instantaneous waveforms and transient pheno...

Страница 76: ...riation is slight the difference between maximum and minimum values breadth or width can be inordinately large if the sampling period is short and if severe fluctuations are present due to noise This phenomena may be prevented by setting a longer sampling period 1 2 3 4 100 1 div Data of One Sample Maximum value Minimum value Data acquired within the specified sampling period 1 2 3 4 100 1 div Dat...

Страница 77: ...elect To control sampling by an external signal select External MR8741 only When external sampling is selected the number of samples per division can be set in the range from 10 10000 S div See 16 2 3 External Sampling SMPL p 338 5 default setting 10 20 50 100 200 500 μs div 1 2 5 10 20 50 100 200 500 ms div 1 2 5 10 30 50 s div 1 min div 100 s div 2 5 min div Recorder Function case 1 Move the fla...

Страница 78: ...67 S s 1 s 1 S s 1 2 s 0 83 S s 3 s 0 33 S s 800 kHz 400 kHz 200 kHz 80 kHz 40 kHz 20 kHz 8 kHz 4 kHz 2 kHz 800 Hz 400 Hz 200 Hz 80 Hz 40 Hz 20 Hz 8 Hz 4 Hz 2 Hz 0 8 Hz 0 4 Hz 0 13 Hz 0 08 Hz 0 04 Hz 0 067 Hz 0 033 Hz 0 013 Hz What is the maximum display frequency Displaying waveforms by their sampled values with adequate resolution of characteristics such as sine wave peaks requires a minimum of ...

Страница 79: ...ence between maximum and minimum values may become quite large as a result of sudden impulses such as noise To prevent such phenomena select a slower sampling rate or enable the input module s lowpass filter p 74 The data refresh rate is not allowed to exceed the maximum sampling rate of the input module During the period when data are not updated the same data are measured resulting in a stair sh...

Страница 80: ...ser Shot Freely specify any value in 1 division units 25 50 100 200 500 1000 2000 5000 10000 20000 50000 100000 div 1 to 160000 div Recorder Function case 1 Move the flashing cursor to the Shot item 2 Select the type Select 3 Set the recording length Select Fixed Shot User Shot Can be inputted by the numeric keypad See 7 1 3 Alphanumeric Input p 139 Fixd Shot Select from a a range of preset values...

Страница 81: ...nits Number of data samples for each division 100 data samples Total number of data samples for recording length Set recording length divi sions 100 2 Each recording length division 100 pairs of data points with each pair com posed of two values the maximum and minimum measured values within each sampling period The resolution of the data measured by the recorder function is 16bit When recording l...

Страница 82: ...hing cursor to the Format item Select Single Display and record using 1 graph default setting Dual Display and record using 2 graphs Quad Display and record using 4 graphs Oct Display and record using 8 graphs Hex Display and record using 16 graphs XYSingle Set input signal to X Y and display and record the correlation using 1 graph XYQuad Set input signal to X Y and display and record the correla...

Страница 83: ...ting p 155 Opening the Channel settings window You can switch setting screens by clicking a tab Click DISP CH SET in the right click menu To hide waveform interpolation Set the waveform display color in the channel setting window to Off See 1 Waveform Display Color p 74 To copy the settings of one channel to another See 7 8 Copying settings to other channels calculation No Copy func tion p 158 ...

Страница 84: ...s necessary 4 Make display color and display position settings See Chapter 8 Trigger Settings p 185 1 Select the channels to use Memory function only Convert input value as necessary Fine tune waveform amplitude as necessary Set zoom on vertical axis voltage axis direction as necessary 5 Vernier p 75 4 Vertical axis Voltage axis Zoom p 75 Set waveform display color Set display position and scaling...

Страница 85: ...ge axis range first If the range is changed after specifying the Variable setting observation with sufficient precision may not be possible When using the Variable and Scaling functions together make the Scaling set tings first If Scaling settings are made after selecting the Variable function the intended display result may not be achieved 1 Make screen display related settings Setting logic reco...

Страница 86: ... coupling should be selected Select 3 5 2 Analog Channel Procedure To open the screen Right click and select DISP Waveform screen Right click and select CH SET Channel settings window Analog sheet 1 2 3 4 5 6 7 1 Move the flashing cursor to the channel for which to make settings 2 Select the settings by clicking the mouse To copy the settings of one channel to another See 7 8 Copying settings to o...

Страница 87: ...amplitude can be adjusted to facilitate calibration See 7 6 Fine Adjustment of Input Values Vernier Function p 156 6 Zero Position Sets the 0 V level display position If the 0 V input level has shifted perform zero adjust See 2 6 Adjusting the Zero Position Zero Adjust p 57 See 2 7 Performing Calibration When Mounting MR8990 p 58 If the zero position of the 8969 and U8969 Strain Unit is out of ali...

Страница 88: ...oom factors LSB Input module Zoom factor 1 10 1 5 1 2 1 2 5 10 20 50 100 8966 Analog 8971 Current 8972 DC RMS 20000 4000 10000 4000 4000 2000 1000 400 200 100 40 20 8967 Temperature 200000 100000 40000 20000 10000 4000 2000 1000 400 200 8968 High resolution U8974 High voltage 320000 64000 160000 64000 64000 32000 16000 6400 3200 1600 640 320 8969 U8969 Strain 250000 64000 125000 64000 50000 25000 ...

Страница 89: ... 5 3 Logic Channel 1 Procedure To open the screen Right click and select DISP Waveform screen Right click and select CH SET Channel settings window Logic sheet 2 3 1 Move the flashing cursor to the channel for which to make settings 2 Select the settings by clicking the mouse To copy the settings of one channel to another See 7 8 Copying settings to other channels calculation No Copy function p 15...

Страница 90: ...splay Sheet Sheet switching 1 to 4 Only the following display related settings can be set to each displayed sheet Analog waveform Display ON OFF waveform color ratio zero position vernier invert graph variable ON OFF upper and lower limit Logic waveform Display ON OFF waveform color display position and logic width X Y waveform Display ON OFF waveform color X ch Y ch waveform calculation X ch Y ch...

Страница 91: ...veform screen When a measurement is started waveform data that were displayed on the screen are cleared However when the measurement conditions are the same the waveform data for up to 16 past measurements is retained as history Measurement can also be started by inputting a signal at the external control terminal See Chapter 16 External Control MR8741 Only p 333 To prevent inadvertent measurement...

Страница 92: ...g Stops Now Storing Recording starts when a trigger event occurs and continues for the specified recording length Start Measurement START Storing Finished Recording Trigger Measurement Trigger mode Single Pre triggering not enabled Single triggering Recording starts when a trigger event occurs continues for the specified recording length and returns to the Trigger Wait state Stop Measurement STOP ...

Страница 93: ...iles Chapter 4 Opening the File Save sheet You can switch setting screens by clicking a tab Click SYSTEM in the right click menu Saving Data p 85 Save Method Auto save Manual save by clicking SAVE Selection save Quick save Operations available from the File Save sheet Save Types Auto Save Waveform data Manual save by clicking SAVE Settings data Waveform data Display screens Waveform screen Numeric...

Страница 94: ...a Preparation p 52 2 Select Change Media and select a storage media The files on the selected storage media are shown in the file list The information about the selected file is displayed To change the media Read only files and folders are shown in blue Deleting or re naming such files is not possi ble The file order will be displayed Ascending order Descending order Click FILE in the right click ...

Страница 95: ...ns waveform evaluation areas O O Waveform evaluation area BMP BMP Waveform evaluation area image data MR8741 only O O O Arbitrary waveform data Binary WFG Arbitrary waveform data For U8793 O O Text TFG Arbitrary waveform data For U8793 O O Arbitrary waveform data Binary PLS Pulse pattern data For MR8791 O O Generation program data Pro gram FGP Generation program data For U8793 O O 1 Multiple data ...

Страница 96: ...e on the Instrument______________________________ Data saved on devices other than the MR8740 MR8741 Memory HiCorder MR8847s Memory HiCorder and MR8827 Memory HiCorder Image files other than waveform evaluation areas file Files larger than 2 GB cannot be saved ...

Страница 97: ...estination Select the data to save Measure Auto Save File Save sheet Waveform data Numerical calculation results After installation and connection turn the power on Insert the storage media Set Select at save to No Select the save destination Select the data to save Click SAVE Save File Save sheet Any of the following can be saved Setting data Waveform data Display screen Waveform screen Numerical...

Страница 98: ... folder is then used as save target To create a new folder select New Folder When LAN is set as the save destination New Folder setting is ignored and the folder named with the current date is created 4 Set the file name Move the flashing cursor to the Save Name and enter the save name See 7 1 3 Alphanumeric Input p 139 When LAN is set as the save destination Save Name setting is ignored and the f...

Страница 99: ...y data items to leave one data item remaining 5 About the save area If the MR8990 is installed one data item more than the number of data items specified with the A and B cursors may be saved The data that is measured and saved with the MR8990 will be the same data twice in a row About divided saving Large quantities of waveform data can be divided and saved as multiple files Saving divided data m...

Страница 100: ... channels in the case of the memory function channels has been set as Used Ch on the Status settings screen Auto If no files with the same name exist saves the file with the desig nated name Otherwise a 4 digit number is automatically added to the beginning of the file name default setting If the first character of the file name is a numeral the added num ber will continue sequentially from that n...

Страница 101: ...orage media becomes full Automatic saving stops Folder name created automatically will be 4 digit number folder name Save To USB HIOKI_MR 8740 Save method Normal Save Folder to save Yes HIOKI_MR8740 AUTO014530 0000AUTO MEM 0001AUTO MEM 0001AUTO014530 A new folder is created automatically when 5 000 files have been saved in the AUTO014530 folder Up to 5 000 files Example 3 Create folder on media au...

Страница 102: ...0000AUTO A new folder is created automatically when 5 000 folders have been saved in the TEST folder Save To USB HIOKI_M R8740 Save method Normal Save Folder to save Yes HIOKI_MR8740 AUTO014530 0000AUTO IDX 0001AUTO MEM 0001AUTO014530 A new folder is created automatically when 5 000 folders have been saved in the 0001AUTO folder Up to 5 000 files Example 6 Saving data in an automatically created f...

Страница 103: ...folder on media was selected a folder named HIOKI_MR8740 or HIOKI_MR8741 is created automatically If the media was initialized in the instrument the folder will already have been created This folder is then used as save target To create a new folder select New Folder When LAN is set as the save destination New Folder setting is ignored and the folder named with the current date is created 3 Set th...

Страница 104: ... er FFT Function only ALL Wave Bin Data of all blocks is saved in binary format Only when the memory division setting is On ALL Wave Txt Data of all blocks is saved in text format When the mem ory division setting is On Screen Copy Save screen display data as a BMP file Data saved in BMP format can be displayed on a PC with image viewing software Wave Image Convert the waveform data to a paper ima...

Страница 105: ...ampling when sav ing data Only a specified subset one out of several data is re tained Screen Copy Hard copy of the display Image Color Color Gray Mono Mono Rev Specifies the color for the created image file Image size UnCompressed Compressed Determines whether the image file is compressed Save GUI Yes No Determines whether the GUI section is also saved Wave Image Print Image Output File All 1 to ...

Страница 106: ...and then perform measurement See Chapter 11 Memory Division Function p 237 2 Right click to display the list menu and then click SAVE 3 Set Save Type to ALL Wave Bin The setting item indication is ALL Bin If you select Wave Binary instead of ALL Wave Bin here the data of the currently displayed block is saved 4 Set Save To See 4 2 3 Saving Data Selectively SAVE p 91 5 Set Save Name See 4 2 3 Savin...

Страница 107: ...ll Blks Saves all blocks with waveforms Start End Saves all blocks from the start block to the end block 8 Configure each setting and then click Exec When the data is saved a folder is created under the name set as the save name and the wave form data of each block and the SEQ file memory block integra tion file are saved in that folder 6 7 8 ...

Страница 108: ...ctly specified Procedure To open the screen press the FILE key to display the File sheet Refer to the instruction manual of Models U8793 MR8790 and MR8791 regarding each detailed save set tings 4 2 5 Save Waveform Output Data to the Media 1 Press Next Page 2 Select Pulse Patt Arb Waveform or Program 3 Enter a Save Name 4 Register a Unit No a Channel No and a Name of the MR8791 or the U8793 5 Press...

Страница 109: ...loading settings data you can select whether to load communication settings such as the IP address of the LAN No Does not load the communi cation settings Default setting Yes Loads the communication set tings 4 3 Loading Data Data Loading Workflow Insert media Select a loading data Extension SET Select whether to load the commu nication settings Select Load Select Exec Loading Settings Data Wavefo...

Страница 110: ...aving a Memory Division Waveform File and then click Exec to load only the waveform data of that block to the instrument Double click this and then click Exec on the right of the screen When loading from a source other than the internal memory Insert the storage media before making the media selection Other limitations Data saved with Memory HiCorders other than the MR8740 MR8741 MR8847s and MR882...

Страница 111: ...Status Screen set Memory Div to On At the File Save sheet of the System Screen set Save Type to ALL Wave Bin See 11 1 Recording Settings p 239 4 2 3 Saving Data Selectively SAVE p 91 Loading a waveform evaluation area MR8741 only Extension Explanation ARE Loads waveform evaluation areas and settings data files saved by selecting Area settings when saving the data BMP Loads waveform evaluation area...

Страница 112: ...n Reference page Media Change Change media p 82 Save Select channels and save settings data and waveform data as files p 101 Sort Sort files on file list in selected order p 105 Open Folder Open the selected folder p 103 Load Load settings data or waveform data from a file p 97 Copy Copy a file to a specified folder If selected item is a folder move to that folder p 106 New Folder Create a new fol...

Страница 113: ...tion settings Settings data and evaluation area MR8741 only Waveform evaluation area Evaluation area MR8741 only Pulse pattern Pulse pattern data registered in the MR8791 Arbitrary waveform Arbitrary waveform data registered in the U8793 Program Program data registered in the U8793 Auto If no files with the same name exist saves the file with the des ignated name Otherwise a 4 digit number is auto...

Страница 114: ...hinning sub sampling is not carried out 1 2 to 1 1000 Set the thinning number out of how many data items to leave one data item remaining Channel will not be saved o Channel will be saved Reset Return to previous settings Analog Channels Logic Channels Waveform Calculation When Wave Calculation is On File name The maximum number of characters for the Save Name string is 123 The maximum path length...

Страница 115: ...er whose contents you want to see 2 Click Open Folder A list with the folder contents appears 4 4 3 Creating New Folders Procedure To open the screen Right click and select FILE File screen To change the media p 82 3 1 Display a screen with the folder level where you want to create a new folder 2 Select New Folder 3 Enter Folder Name See 7 1 Adding Comments p 136 4 Select Exec A new folder is crea...

Страница 116: ...letePlural is shown as deletion target Select Selected files or folders are shown in red see illustration at right 4 Select Exec The selected files or folders are deleted To cancel deleting Select Cancel Slct Deslct Select the individual file or folder at the cursor If something is currently selected the selection is cleared Slct Deslct All Select all files or folders If something is currently sel...

Страница 117: ...haracters Type Sorts files by type file format of data settings MEM waveforms etc Date Sorts files by time and date of creation Size Sorts files by size Ascending order A Z Old New Small Large Descending order Reverse sort order 1 Select The order format will be displayed in the file list with Ascending order Descending order mark and marked by the GUI When there are both files and folders folders...

Страница 118: ...and confirm the setting with Confirm 5 When there are multiple copy targets Select Multi Files Select Selected files or folders are shown in red see illustration at right Select Select End 6 Select Exec The file is copied to the specified target location To cancel copying Select Cancel Slct Deslct Select the individual file or folder at the cursor If something is currently selected the selection i...

Страница 119: ...ronment File Save Printer Init Interface Making printer settings Grid Type p 111 Channel Marker Type p 111 List p 112 Gauge p 112 Horizontal axis Time axis Zoom Mag Comp p 112 Upper Lower Limit Print p 113 Zero Position Comment Print p 113 Print Counter p 113 Selecting the print method See 5 1 Printing Type and Workflow p 108 Auto Print p 109 Manual Print p 110 See 5 5 1 Screen Hard Copy p 114 See...

Страница 120: ... Waveform screen Waveform At File screen File list At other screen List During waveform printing the range specified with Print Area is print ed Quick Print Prepare Model 9333 LAN Communicator Set measurement configuration Set print target for Auto Print Set the print contents Measurement Print Printer sheet The followings can be print ed simultaneously Waveform data Numeric value calculation resu...

Страница 121: ...sure ment Press the START key Memory Function case Data are acquired for the recording length and then printed auto matically FFT Function case Data is printed automatically after FFT analysis is exited When printing is carried out again after stopping the range selec tion will be used Whole Wave Print all waveform data in internal memory of instrument default setting A B Wave Print only A B curso...

Страница 122: ...pped be fore starting to print 3 Select print contents and execute printing If the Send Print Key is executed by using Model 9333 the GUI Select at print is displayed at the right on the screen Select When the selection except for Cancel has been made printing starts Whole Wave Print all waveform data in internal memory of instrument default setting A B Wave Print only A B cursor defined range of ...

Страница 123: ...channel marker type Move the cursor to the Ch Mark item Select Off Standard default setting Fine Std Dark Fine Dark Channel number Comment Print Example 1 Voltage Off Do not print the channel number or com ments Ch No Print the channel number default setting Comment Print the comments entered in the Channel Settings screen over the waveform A comment setting must have been made See 7 1 Adding Comm...

Страница 124: ... trigger event unit is modulo 60 div Print the number of divisions from trigger event Date Print the date and time when waveform was acquired Sample Num Print the number of samples from trigger event Off Do not print a list default setting On Print list after waveform Print Example Gauge List Off Do not print a gauge default setting Before Wave Print gauge before waveform After Wave Print gauge af...

Страница 125: ... count is automatically cleared to zero when the instrument is powered on The count is increased by 1 each time a waveform is acquired Maximum count 9999 When Name is selected Enter a counter name Move the cursor to the Counter Name and enter a counter name up to 10 characters See 7 1 3 Alphanumeric Input p 139 Print Example Upper and Lower Limit Off Do not print upper and lower limits default set...

Страница 126: ...r pair shown on the Waveform screen is also printed If the comment type is set to Comment or Set Com on the Comment sheet of the Channel screen the title comment can also be printed 5 5 Miscellaneous Printing Functions 5 5 1 Screen Hard Copy GUI print setting To open the screen Press the SYSTEM key Printer sheet Print Example GUI section 5 5 2 Report Print A4 Size Print See 7 1 1 Adding a Title Co...

Страница 127: ...use the File screen to import the text file created on the PC into the MR8847 See 4 3 Loading Data p 97 The text file content will be printed along with the waveform when printing Print Example _ Positioning with regard to other print items 5 5 3 List Print See Print a list of settings p 112 The printed list contains the setting parameters for the acquired waveform data The list content will not c...

Страница 128: ...5 5 Miscellaneous Printing Functions 116 ...

Страница 129: ...ng X Y Synthesis p 125 A B Cursor Read measurement value p 118 Specifying a Waveform Range p 122 Operations available from the Waveform screen Monitoring Input Levels p 130 Switching the Waveform Screen p 132 Displaying upper and lower limit values Displaying comments Switching the waveform display width Moving the Waveform Display Position Moving the waveform p 123 Moving the position p 124 Magni...

Страница 130: ...Kind item and select it 4 Select the measurement target channel Subject CH for A and B Select Move the flashing cursor to the A or B item and select it 5 Move the A B cursors If you click while the mouse cursor is in the Waveform screen the A B cursors move to that position Furthermore you can also move the A or B cursor by dragging the A or B cursor mark on the Waveform screen while holding down ...

Страница 131: ...m Display Width p 133 To view the waveform before or after the A B cursors when these are off the screen When using the A B cursors the waveform at an off screen cursor location can be dis played using the Jump function See 6 3 3 Moving the Position p 124 If A B cursors are activated but do not show up on screen The position of the A B cursors can be checked on the scroll bar p 123 If the cursor t...

Страница 132: ...Time difference between A B cursors See Screen display above 1 t Frequency for which t is 1 cycle Range Measurement Values A B each cursor value Measured value of channel B A value Difference between measured values at A B cursors Trace Time and Mea surement Values Time Values A B each cursor value Time from trigger point or recording start B A value Time difference between A B cursors Measurement...

Страница 133: ...B Value Difference between measured values at A B cursors Cursor Value Cursor Type Cursor Value Cursor Value Display Example with two cursors X X axis measure ment value See Screen display above Y Y axis measure ment value Trace Time and X axis Y axis measure ment value A B B A A B B A Cursor A measurement value Cursor B measurement value Difference between mea sured values at A B cursors Y axis c...

Страница 134: ...cal calculation Status screen Num Calc sheet Calc Area item Select A B Wave See 9 2 Settings for Numerical Value Calculation p 210 6 2 Specifying a Waveform Range A B Cursor Cursor position can be verified A Cursor B Cursor About reading measurement values and cursor types See 6 1 Reading Measurement Values Using the A B Cursors p 118 Available range for A B cursor The available range depends on t...

Страница 135: ...B Blue frame Screen display range 25 div With zoomed display p 128 Blue frame Zoomed display range lower waveform Pink frame Display range upper waveform Red bar Recorded waveform Gray bar if waveform is within recording length 6 3 2 Scrolling the Measurement Waveform Scrolling measured waveforms left or right To open the screen Left click the WAVE icon 1 Left click the WAVE icon Left click the WA...

Страница 136: ...E icon Left click the WAVE icon on the top right of the Waveform screen 2 Use the mouse to specify a position on the scroll bar of the screen 3 Left click the mouse The selected display position appears on the screen Moving the position when Memory Div On with the Memory function Click the WAVE icon With no block displayed in the upper part of the screen move the position When a block is displayed...

Страница 137: ...en click See 6 2 Specifying a Waveform Range A B Cursor p 122 Select X Y Single The waveforms of graphs 1 8 are shown and recorded on a single screen X Y Quad The waveforms of graphs 1 8 are shown and recorded on a quadruplet screens Dots Measurement data only are shown as dots Order stored in memory will no longer be known Line Measurement data are linked by a line in the order stored in memory a...

Страница 138: ...ings the data will not be saved See Select the channels to save p 102 On The waveform is displayed Set the display col or by clicking or 4 5 Synthesis for A B section of a waveform Perform the following steps 1 Right click and select STATUS to bring up the Status screen and select the Status sheet 2 Select 1 2 4 8 or 16 screens as Format 3 Right click and select DISP to display the waveform 4 Use ...

Страница 139: ...forms 6 5 1 Magnifying and Compressing Horizontal Axis Time Axis Normal Display Magnified Display x2 Procedure To open the screen Right click and select DISP Waveform screen 1 Move the flashing cursor to the magnification item and click it 2 Select display magnification Memory Function Select When Zoom On is selected a section of the time axis will be mag nified See 6 5 2 Zoom Function Magnifying ...

Страница 140: ...ion is enabled and the screen is split into upper and lower halves Upper waveform to be magnified Lower magnified zoomed section of waveform 3 Select display magnification for the zoomed waveform sec tion Move the flashing cursor to the Zoom Mag and set the magnification The zoomed waveform section at the lower half of the screen is magnified When the same value or a smaller value than the magnifi...

Страница 141: ...on only Move the flashing cursor to the ratio item in the settings window and select All Wave The waveform information for the entire recording length is displayed Normal Display Zoomed Display 6 5 3 Magnifying and Compressing Vertical Axis Voltage Axis Normal Display MagnifiedDisplay Procedure To open the screen Right click and select DISP Waveform screen Right click and select CH SET Channel set...

Страница 142: ...rm screen Monitor values of analog channels Up to 6 digits are displayed Display menu Display format 2 16 screens p 70 Level monitors are displayed for each graph Upper and lower limit indication is combined with level monitor See 6 7 1 Showing Upper Lower Limit On Waveform Screen p 132 Logic channel level display Level display of an analog channel High Hi gh Low Low Input Level Waveform Display R...

Страница 143: ... screen The display changes to numerical value DMM display To return to the Waveform screen Left click Back to waveform in the display menu on the right of the screen To pause hold display Left click HOLD ON OFF in the display menu on the right of the screen The HOLD mark appears at the top of the screen to indicate that the screen is in the HOLD state Click HOLD ON OFF in the HOLD state to cancel...

Страница 144: ...nt information must have been entered via the Comment sheet on the Channel screen See 7 1 Adding Comments p 136 When overlapped with other displayed elements the comments may not display properly Hide the Chan nel Settings Window Trigger Settings Window Level Monitor etc or decrease the Wave Width 6 7 Switching the Waveform Screen Display Display Menu Procedure To open the menu Right click and sel...

Страница 145: ...ges each time you click Format Click Change Ch to change the channels displayed at the bottom of the screen CH1 to CH16 and CH17 to CH32 When level monitoring is ON The channel displayed for analog monitoring changes When level monitoring is OFF The channel displayed for the range setting changes Select to switch the displayed sheet The settings of each displayed sheet can be specified on the Unit...

Страница 146: ...Green blocks Currently selected displayed block Blocks with light blue frame Referenced blocks 1 Right click and select DISP to display the Waveform screen Left click the rectangle of the block to display When there are more than 32 blocks click to the right side of the last block to display the next 32 blocks and click to the left side of the first block to display the previous 32 blocks 3 When t...

Страница 147: ... values Scaling p 146 Detailed input module settings p 159 Making anti aliasing filter settings Selecting the thermocouple type Making reference point compensation settings Making wire break detection settings Making data updating settings Executing auto balance Making probe attenuation settings Making response settings Making measurement mode settings Copying a setting to another channel p 158 Fi...

Страница 148: ...re To open the screen Right click and select CHAN Comment sheet 1 Enter a title comment Select Move the flashing cursor to the Title Com ment item and then click Input Enter comment text See Entering Text p 139 Clear Clear entered information Undo Return to condition of preceding step To select from preset terms Clicking PRESET after activating text input brings up a list of preset terms It is als...

Страница 149: ...ying settings to other channels calculation No Copy function p 158 1 Procedure To open the screen Right click and select CHAN Comment sheet 1 Enter the comment for each analog chan nel Select Move the flashing cursor to the Comment item and then click Input Enter comment text See Entering Text p 139 Clear Clear entered information Undo Return to condition of preceding step To select from preset te...

Страница 150: ... text See Entering Text p 139 Clear Clear entered information Undo Return to condition of preceding step 2 3 To select from preset terms Clicking PRESET after activating text input brings up a list of preset terms It is also possible to select words from previously entered titles History func tion See Entering Text From a Term List Or History List p 140 ...

Страница 151: ...he virtual keyboard 7 1 3 Alphanumeric Input Entering Text RESET Deletes all entered characters SPACE Inserts a space OVWR INS Toggles between Overwrite OVWR and Insert INS mode Move the character input position left Move the character input position right Character input position Move with or the mouse wheel Character selection cursor ESC Entering units and symbols Characters entered at the unit ...

Страница 152: ... To select from preset terms Click Term List A list of preset terms appears To select from past input Click History List A History list appears Click ESC to cancel selection from the history list 3 Select the word to enter from the list You can also select the word to enter by double clicking it 4 Select Confirm to accept the entry The virtual keyboard disappears To return the edited field to the ...

Страница 153: ... that can be changed The selection cursor moves to that location Rotate the mouse wheel This allows you to increase or decrease the value of the digit where the selection cursor is located If the value is changed in the up direction the current numeral itself increases If there is a minus sign at the beginning the numerical value of the digit decreases the set value increases 3 Click Confirm The c...

Страница 154: ... A virtual keyboard for numeric keypad input appears 2 Use the virtual keyboard for numeric keypad input 3 Click Enter The entered value is confirmed Click ESC to cancel the input Entering Numerals With a Numeric Keypad BS Delete 1 character C Delete all characters E Exponent entry µ m k M Unit prefix ...

Страница 155: ... record ing length so with slow sampling there may be a long wait after starting mea surement before the waveform is displayed 7 2 Displaying Waveforms During Recording Roll Mode Procedure To open the screen Right click and select STATUS Status sheet Move the flashing cursor to the Roll Mode item Select Off Normal recording Data is displayed only after acquiring the specified recording length On W...

Страница 156: ... Overlay disabled default setting Auto Each time a waveform is acquired it is automatically dis played as an overlay When the trigger mode is Cont or Auto waveforms will be overlaid from start until stop Manual Overlay waveforms on the screen manually Regardless of the trigger mode the waveform is left on the screen p 144 This mode cannot be used simultaneously with the Roll Mode When the Overlay ...

Страница 157: ...ns the Roll Mode Auto The following operations are not available on the Waveform screen Waveform scrolling Zoom function On Off Changing horizontal axis time axis magnification compression Changing zero position In the following cases overlaid waveforms are cleared and only the most recent waveform is displayed When Format was changed on the Status sheet When the Combo Area setting has been change...

Страница 158: ...aling Set the physical value per volt conversion ratio eu V of the input signal an offset value and mea surement unit name eu engineering units for conversion so measurement values acquired as voltage are converted to the specified units Example Conversion ratio A value per volt Offset value B Unit name A Conversion Ratio Setting A V Convert from slope conversion ra tio and offset value B Example ...

Страница 159: ...ield When you have selected 2 Point set input val ues for two points and the values after conver sion Move the flashing cursor to the Input P1 Scale P1 Input P2 and Scale P2 Enter numerical values in each field Off No scaling NUM Displayed as a decimal and includes a unit m k etc SCI Displayed as an exponent the power of ten Ratio Specify by conversion ratio Point Specify by two points 9 9999E 9 t...

Страница 160: ...lation No Copy function p 158 Using the Scaling and Variable functions p 153 in combination The full span of output from a sensor can be displayed p 155 At factory shipping automatic correction of the variable function p 307 is set to On At this time the Variable setting is altered so that it is linked to dependent upon the vertical axis voltage axis range and scaling settings If you want the Vari...

Страница 161: ...th current Ampere values See Upper lower limit p 132 Cursor A B value p 118 Before Scaling After Scaling A Using Model 8969 or U8969 Strain Unit Example 2 Using the 20 G rated capacity and a strain gauge transducer with 1000 μV V rated output display measured data in units of G Setting Items Setting Choice Disp NUM Unit G Rated Cap Rated capacity 20 G Rated Output 1k By using the Scaling function ...

Страница 162: ...oth Gauge Fac tor and physical value conversions In this case the conversion ratio setting is the product of the conversion ratios of the Gauge Factor and measurement unit scaling The Gauge Factor component of the conversion ratio is 0 952 and the physical value component is 0 001442 Conversion Ratio 0 952 x 0 001442 0 0013728 As in Example 3 enter 0 0013728 as the conversion ratio To convert meas...

Страница 163: ...Input Values Scaling Function 151 6 Chapter 7 Utility Functions 7 object The conversion method depends on the conditions in which the strain gauge is used See Appendix 2 6 Scaling Method When Using Strain Gauges p A9 ...

Страница 164: ...t dB Scal ing 3 In the displayed entry field and physical quantity field enter 40 dB and 60 dB respectively After entering the values select Confirm See 7 1 3 Alphanumeric Input p 139 The conversion rate for the entered dB value is entered The offset becomes 0 Using the dB value Example 5 Acquiring the conversion rate to convert 40 dB input to 60 dB 1 2 2 ...

Страница 165: ...is play the waveform amplitude full screen Settings for the Variable function can be made for each individual channel using the Each Ch sheet accessed from the Channel screen p 154 or for all chan nels using the Display range window p 155 7 5 Variable Function Setting the Waveform Dis play Freely Precautions for using the Variable Function Verify that the vertical axis voltage axis range is set pr...

Страница 166: ...hing cursor to the Upper and Lower and specify the values When this is changed the display range and zero position values also change ac cordingly 4 To reset the settings Select Reset to return the set tings to the default values When upper and lower values are set waveforms can be displayed at full span on the screen Depending on the scaling setting the upper and lower display values may be less ...

Страница 167: ...alues To display the full span of output from a sensor By using the Scaling function in combination voltage from a sensor can be con verted to the physical units of the measurement object Procedure To open the screen Right click and select DISP Waveform screen Right click and select CH SET Display range window 1 Enable the Variable function Move the flashing cursor to the Variable and select On 2 ...

Страница 168: ...2 V 1 0 V Procedure To open the screen Right click and select DISP Waveform screen Right click and select CH SET Channel settings window Analog sheet 1 Move the flashing cursor to the vernier setting item of the channel to adjust 2 Make the adjustment while watching the waveform Vernier Magnify waveform Vernier Compress waveform Vernier Reset Return waveform to original position The adjustment ran...

Страница 169: ...ng it away from the observer as the plus direction the output will be minus negative for pulling and plus positive for pushing 7 7 Inverting the Waveform Invert Function Procedure To open the screen Right click and select DISP Waveform screen Right click and select CH SET Channel settings window Analog sheet 1 Move the flashing cursor to the Mag item for the channel whose waveform you want to inve...

Страница 170: ...settings to other channels calcula tion No Copy function Procedure To open the screen Right click and select DISP Waveform screen Right click and select CH SET Display range window 1 Click the copy source channel number calculation No 2 Select Copy 3 Click the channel number calculation No where you want to paste the settings 4 Select Paste To copy to all channels calculations select a chan nel nu...

Страница 171: ...it is installed on unit 1 unit 1 or unit 2 in the case of MR8741 the standard logic can no longer be used 7 9 Making Detailed Settings for Input Modules Select the channel Shows the chan nel num ber and channel position Opening the Each Ch sheet Making a Channel Selection Click CHAN in the right click menu Module Memory for each channel 16 bits 4 bits 4 bits 4 bits 4 bits Ch1 Analog Analog Ch1 LA ...

Страница 172: ...lect 7 9 1 Making Settings for the Anti Aliasing Filter A A F 8968 High Resolution Unit Selections Description Off The anti aliasing filter is disabled default setting On The anti aliasing filter is enabled When the External sampling is used the antialiasing filter AAF is not available 7 9 2 Probe Attenuation Selection Selections Description 1 1 Model L9197 L9198 or L9217 Connection Cable connecte...

Страница 173: ...rement Range Selections Measurement Range Temp K 200 to 1350 C Temp R 0 to 1700 C Temp J 200 to 1100 C Temp S 0 to 1700 C Temp E 200 to 800 C Temp B 400 to 1800 C Temp T 200 to 400 C Temp W 0 to 2000 C Temp N 200 to 1300 C Selections Description INT Reference junction compensation is provided within the input mod ule default setting Measurement Accuracy The sum of the accuracies of the temper atur...

Страница 174: ...surement while removing noise For quicker response select Fast but note that this will make the mea surement more susceptible to noise For further improved measurement stability select Slow Select Selections Description Fast Data are updated approximately every 1 2 ms Normal Data are updated approximately every 100 ms default setting Slow Data are updated approximately every 500 ms ...

Страница 175: ...indow Analog sheet if the range of a channel with installed strain unit is selected See Opening the Channel settings window Analog sheet p 74 In the following cases auto balance should be executed again After changing the vertical axis strain axis range After an input module has been removed or inserted After the strain gauge transducer has been replaced After power has been turned off and on Afte...

Страница 176: ...LA and LB is on the 8970 Freq Unit installed on unit 1 can no longer be used Selections Description Frequency Measure the frequency of the measurement waveform Hz hertz default setting RPM Measure the number of rotations of the measurement target r min rotations minutes P Freq Measure the power frequency variation Hz hertz Count Add up the number of input pulses Duty Measure the duty rate of the m...

Страница 177: ...re detected 1 default setting to 4096 Selections Description Start When START is clicked summing is started default setting Trig When a trigger is applied summing is started When the Start is set there is some internal processing time between click ing START and the start of measurement Therefore the count value is not zero at the start point When the Start is set and the trigger level is exceeded...

Страница 178: ...e frequency and summing Select Selections Description High Measures above the threshold value default setting Low Measures below the threshold value Selections Description Off The measured data is recorded as is A step waveform default setting On The measured data is interpolated so that the waveform is smooth and then it is output Further delayed from upper limit 10 kHz and Off Selections Descrip...

Страница 179: ...to 2 00 Range Select 7 9 6 Settings for the 8971 Current Unit Selections Description 20A 2V Sets this option when Model 9272 10 20 A range 9277 or CT6841 Clamp Sensor is connected default setting 200A 2V Sets this option when Model 9272 10 200 A range 9278 CT6863 or CT6843 Clamp Sensor is connected 50A 2V Sets this option when Model CT6862 Clamp Sensor is connected 500A 2V Sets this option when Mo...

Страница 180: ...ormally set to Fast this can be changed to Normal or Slow to stabilize the display when measuring low frequencies or when severe fluctuations are present Select 7 9 7 Settings for the 8972 DC RMS Unit Selections Description DC Voltage measurement default setting RMS RMS measurement Selections Description Fast Sets the response time to about 100 ms default setting Normal Sets the response time to a...

Страница 181: ...ing synchronization between channels enables matching the timing for the start of integration 7 9 8 Settings for the MR8990 Digital Voltmeter Unit When the MR8990 Digital Voltmeter Unit is installed on unit 1 unit 1 or unit 2 in the case of MR8741 the standard logic can no longer be used The resolution of the data measured by the recorder function is 16bit Selections Description 50Hz Cycle 20 ms d...

Страница 182: ...n is sent to each unit when measurement is started and the wait process is per formed until the first integration finishes The wait time required for this process is 10 ms integration time The integration time varies depending on the NPLC setting If synchronization is not performed the above wait time will also be required for measurement performed immediately after the settings of the Digital Vol...

Страница 183: ...an be set to three speeds Fast Nor mal and Slow The response time can be set to Slow to stabilize the measured value when the frequency is low or when severe fluctuations are present Select 7 9 9 Model U8974 High Voltage Unit Settings Selections Description DC Voltage measurement Default setting RMS RMS measurement Selections Description Fast Response time is set to 150 ms Normal Response time is ...

Страница 184: ...range parts of the waveform will be clamped to the upper limit approximately 14 V and the lower limit approximately 14 V Offset For DC output Sets DC voltage For sine wave output Sets the offset voltage The output voltage with guaranteed accuracy is the sum of the amplitude and the offset between 10 V and 10 V If the sum of the amplitude and the offset is set outside the guaranteed accuracy range ...

Страница 185: ...om internal circuits Selections Description On Outputs waveform Off Does not output the waveform Selections Description RUN Starts output PAUSE Pauses output While output is paused the output at the time PAUSE was pressed will be output STOP Stops output Selections Description Manual Restricts control of signal output to Signal Generation screen Sync Augments manual control with signal output in s...

Страница 186: ...uction manual of Models U8793 MR8790 and MR8791 regard ing the detailed settings for pattern output Frequency Sets the frequency for pulse output Duty Sets the pulse duty Out Config Sets the output status Select 7 9 11 MR 8971 Pulse Generator Unit Settings Selections Description Pulse Pulse output Default settings Pattern Pattern output 0 Hz to 20000 Hz 0 to 100 Selections Description TTL TTL outp...

Страница 187: ... Starts output PAUSE Pauses output While output is paused the output at the time PAUSE was pressed will be output STOP Stops output Selections Description Manual Restricts control of signal output to Signal Generation screen Sync Augments manual control with signal output in synchronization with the start and end of measurement START key Starts output when measurement starts STOP key Stops output ...

Страница 188: ...f the amplitude and the offset between 10 V and 10 V If the sum of the amplitude and the offset is set outside the guaranteed accuracy range parts of the waveform will be clamped to the upper limit approximately 16 V and the lower limit approximately 11 V 7 9 12 U8793 Arbitrary Waveform Generator Unit Set tings Selections Description DC DC output Default setting Sine Sine wave output Square Rectan...

Страница 189: ...y Sets the duty when selecting pulse wave When Off Sets the output terminal status when the output is off Select Output Turns waveform output On Off Select Control Sets the waveform output Select 10 V to 15 V 360 to 360 0 1 to 99 9 Selections Description Open Opens the output terminals separating them from internal circuits Short Short circuits the output terminals separating them from internal ci...

Страница 190: ... is progressive Loop Set the repetition count for generating waveforms Amp Adj Set the amplitude level for waveform output Offset Set the offset voltage for waveform Selections Description Manual Restricts control of signal output to Signal Generation screen Sync Augments manual control with signal output in synchronization with the start and end of measurement START key Starts output when measure...

Страница 191: ...en and select Arbitrary using the F keys 2 Register the waveform Move the cursor to the item listed below Arbitrary on the settings screen 3 Select a reading source of the waveform Select Selections Description Resister From File Registers from data saved in the media Register From Meas Registers the data measured using memory function You can also register after reading the MEM files from media t...

Страница 192: ...bitrary Waveform Generator Unit 180 Register From Files 1 Select Register from file using F keys 2 Select to File scrn using the CH SET key Move to the file screen 3 Select arbitrary waveform file WFG or TFG on the file screen and then register ...

Страница 193: ... count more than 250 000 maximum registerable data count cannot be registered 2 2 6 3 4 5 Select Selections Description Analog Ch Registers the waveform of the measured analog channel Wave Calc Z Registers the waveforms with waveform calculation result Analog waveform Ch1 to Ch32 Waveform calculations Z1 to Z16 Select Selections Description Whole wave forms Registers the whole wave A B waveforms R...

Страница 194: ...et the conversion ratio 6 Enter a data name Register as an arbitrary waveform data in the U8793 memory Enter a Name When a data name is not entered the data will be registered as NONAME Amplify or attenuate a voltage value of the measured data to register it 0 001 times to 100 times ...

Страница 195: ...gs while outputting and measuring the resulting waveform pro vides a convenient way to measure a waveform while varying its parameters 7 11 Save the Waveforms Registered in the Model U8793 in the Media 7 12 Setting Output Waveform Parameters 1 Display the Waveform screen if viewing another screen press DISP to display the Waveform screen 2 Press CH SET to display the tabs 3 Press CH SET or select ...

Страница 196: ...7 12 Setting Output Waveform Parameters 184 ...

Страница 197: ...orm display width to divide the waveform display screen and trigger settings screen Refer to 6 7 3 Switching the Waveform Display Width p 133 Trigger Settings Trigger mode setting p 187 Combining logic AND OR for multiple trigger sources p 204 Pre trigger settings p 200 Analog Trigger Settings p 188 Level trigger Window trigger Period trigger Glitch trigger Slope trigger Logic Trigger Settings p 1...

Страница 198: ...he right click menu to start measuring However operation differs according to the setting for Start Action p 307 Data acquisition starts when trigger criteria are met To stop measurement Click STOP in the right click menu Click once recording stops at the end of the specified recording length Click twice recording stops immediately Available settings for the respective items depend on the function...

Страница 199: ...merical calculation triggering will not be accepted 8 2 Setting the Trigger Mode Procedure To open the screen Right click and select DISP Waveform screen 1 Move the flashing cursor to the Trigger item 2 Select the trigger mode Select Single Only one trigger is recognized After measurement is start ed once a trigger is applied a waveform is recorded for the specified recording length and measuremen...

Страница 200: ...yed on the screen 3 Use the mouse to move the flashing cursor to the parameter item 4 Set the parameter value from the GUI displayed on the screen 1 3 1 Level Trigger p 189 2 In Window Trigger Out of Window Trigger p 189 3 Voltage Sag Trigger p 190 4 In Period Trigger Out of Period Trigger p 190 5 Glitch Trigger p 191 To copy the setting to another channel The Trigger settings window Analog Trig s...

Страница 201: ...iggering occurs when the signal crosses the threshold trigger level on the upslope rising edge or on the downslope falling edge With the set ting triggering occurs in either direction Event The number of signal rising edge or falling edge events is counted and triggering occurs when the Event number set here is exceeded 1 to 4000 F Filter Triggering occurs when the trigger criteria are met within ...

Страница 202: ...L Level Sets the level voltage value for the trigger The setting can be made in 1 50 increments S Slope Determines whether triggering occurs when the signal crosses the threshold trigger level on the upslope ris ing edge or on the downslope falling edge P Period lower limit 1 Available settings are 0 and more than 5 times the sam pling frequency Settings higher than the upper limit val ue are not ...

Страница 203: ...n the Event number set here is exceeded 1 to 4000 Width Sets the pulse width time that is used to determine a glitch Triggering occurs when the width is lower than this value The available setting range depends on the sam pling frequency Lower limit sampling frequency x 2 up per limit sampling frequency x 4000 Glitch Width Trigger Level Input Waveform Trigger Slope T When Using Noisy Signals for T...

Страница 204: ...reshold to 0 The lower threshold is ignored and triggering occurs when the frequency drops below that corresponding to the upper threshold About the trigger point of the Out of Period trigger Triggering occurs when the period of sequential crossings of the specified refer ence voltage exceeds the period range The point at which triggering occurs depends on the specified period range and the period...

Страница 205: ...h 1 Trigger Sets the trigger probe combining logic AND OR Select 2 Filter Sets the filter width trigger filter for triggering as occasion demands Suppresses triggering from noise p 191 Select 8 4 Triggering by Logic Signals Logic Trigger Procedure To open the screen Right click and select DISP Waveform screen Right click and select TRIG SET Trigger settings window Logic Trig sheet 1 Move the flash...

Страница 206: ...3 4 1 0 X X X Ignore signal default setting 0 Trigger at LOW signal level 1 Trigger at HIGH signal level To copy the setting to another channel The Trigger settings window Logic Trig sheet can be used to copy a setting See 7 8 Copying settings to other channels calculation No Copy function p 158 Trigger Pattern T LA1 1 LA2 0 LA3 X LA4 X Trigger Pattern T LA1 1 LA2 0 LA3 X LA4 X T If the conditions...

Страница 207: ...me To set the current date and time Select Present Time 3 To apply a trigger through the specified interval from Start to Stop Set the Interval Move to cursor to the D h m and s items of Interval Set the recording interval Recording starts at the specified Start time To stop recording early Click STOP in the right click menu Off Timer triggering is disabled On Timer triggering is enabled Start Tim...

Страница 208: ...ng processing auto save waveform display processing and calculation from the end of recording to the next Trigger Wait state so depending on measurement settings recording may not occur within the specified interval About Stop Time and Recording Length The stop time is function dependent Memory function Measurement data is acquired for the specified recording length then recording stops Recorder f...

Страница 209: ...es set within the specified interval are satisfied If the interval is set to zero triggering occurs when criteria for all trigger sources set between specified Start and Stop times are satisfied Example measuring when both timer trigger and level triggers Slope are enabled When trigger criteria are ORed together Trigger Source OR Start Measurement Start Time Stop Time Level Trigger Timer Trigger R...

Страница 210: ...er settings window 1 Enable synchronization between blocks Move the flashing cursor to the Sync blocks item Select Off Synchronization between blocks is not performed default setting On Synchronization between blocks is performed To synchronize block I and block II trigger synchronization needs to be set for both blocks The sampling offset between blocks is within 3 samples or 1 us If the sampling...

Страница 211: ... signal to the external trigger EXT TRIG terminal See 16 2 5 External Trigger terminal EXT TRIG p 340 Off Disables external triggering default setting On Enables external triggering 8 8 Triggering Manually Manual Trigger Triggers can be applied manually by clicking MANUAL TRIG in the right click menu Manual triggering takes priority over all other trigger sources regardless of settings To stop rec...

Страница 212: ...all trigger sources analog timer trigger etc are disabled Off pre trig ger settings are ignored Pre triggers cannot be set by div with the FFT function 8 9 1 Setting the Trigger Start Point Pre Trigger Procedure To open the screen Right click and select DISP Waveform screen 1 Select the unit to set the pre trigger Move the flashing cursor to the Pre trigger Select 2 Enter the numerical value When ...

Страница 213: ... period indicated as Trigger wait continues until a trigger occurs See Measurement and Internal Operations p 80 Trigger Point 95 95 of the recording length is recorded before the trigger point 50 50 of the recording length is recorded before and 50 after the trigger point 95 95 of the recording length is recorded after the trigger point T Pre Trigger setting examples Trigger events during the spec...

Страница 214: ... Trigger events are ignored during Pre Trigger wait default setting On Trigger events are recognized accepted during Pre Trigger wait 50 of Recording Length before trigger Trigger Priority Off T After 50 of the Recording Length is recorded internally the Trigger wait state begins Trigger wait Pre Trigger wait 50 of Recording Length after trigger T Trigger ignored Now Storing Start Measurement Reco...

Страница 215: ...when a trigger event occurs Recording stops when a Stop trig ger event occurs If no trigger event occurs before the specified recording length elapses Stop or Start Stop Recording stops after data has been acquired for the specified recording length With Repeat trigger mode The Trigger Wait state begins af ter data has been acquired for the specified recording length When another trigger event oc ...

Страница 216: ... cases 8 11 Setting Combining Logic AND OR for Multiple Trigger Sources Procedure To open the screen Right click and select DISP Waveform screen Right click and select TRIG SET Trigger settings window Memory Function case Move the flashing cursor to the Trig Src item Select OR Triggering occurs when any one of the specified trigger source criteria is met default setting AND Triggering occurs only ...

Страница 217: ...ge Move the flashing cursor to the Area item Select When using memory division Select 3 Execute search Move the flashing cursor to the Trig search item Select Whole Wave Search all measured data default setting A B Wave Search in the range between A B cursor Whole Display Blocks Applies search to the whole display blocks A B Display Blocks When setting the A B cursors on the display blocks ap plie...

Страница 218: ...een and an S mark is displayed in this position When no matches are found a message stating that no matches were found is dis played Pre triggers trigger priorities external triggers and timer triggers cannot be used as search conditions The trigger position and search results may not match Data measured with MR8990 Digital Voltmeter Unit cannot be searched ...

Страница 219: ... calculation Phase contrast calculation High level calculation Low level calculation Total of 24 types Specified calculation between A B cursors Waveform calculations can be limited to data within the range specified by A B cursors Calculation performed with MR8990 Digital Voltmeter Unit is in valid Calculation operator details 9 5 Numerical Calculation Type and Description p 219 Numerical Calcula...

Страница 220: ...on results To automatically save calculation results make saving settings before measuring Saving calculation results automatically p 214 p 217 Start Measurement Acquire Data The instrument acquires data when the trigger criteria are met If triggering is not enabled the instrument acquires data when measurement is started Calculate Measurement appears on the screen s status bar Calculations are pe...

Страница 221: ...played on the Waveform screen p 213 Calculation Judgments only if judgments are enabled Save Save calculation results as occasion demands Save SAVE When Save Calc Result p 217 is set to On results are automatically saved When specifying a waveform range for calculation Before executing a calculation specify the calculation range using the A B cursors div or Trace cursors on the Waveform screen Set...

Страница 222: ... Pulse width of waveform data Duty Ratio 2 Duty of waveform data Pulses 2 Pulse count of waveform data Calculation Four arithmetic operations on numerical calculation results Time Diff 2 Time difference between phenomenon A and B Phase Diff 2 Time difference between phenomenon A and B displayed as a phase contrast High Level 1 High level value for waveform data Low Level 1 Low level value for wave...

Страница 223: ...cal culation has been selected set Ch channel and param eters for A and B 4 Execute the calculations when judging calculations p 214 Applying Calculations to Existing Data Select Exec When calculating automatically after measurement Click START to start measurement First Calculate at the first condition of the measurement data Average Acquire the average value of the calculation result in the meas...

Страница 224: ...Calculates the time specified level is crossed F Filter Only when the measurement signal has crossed the level and has not crossed the level again within the specified filter width it is taken as a valid event This is useful to exclude level crossing events due to noise S Slope Determines whether the time is calculated until the signal crosses the specified lev el on the upward slope or on the dow...

Страница 225: ...waveform display width in the DISP menu Numerical values and waveforms are displayed separately See 6 7 3 Switching the Waveform Display Width p 133 To save calculation results after measuring Set the Select at save item to Yes When you click SAVE after measure ment you can select the content to be saved Select Calc Result See 4 2 3 Saving Data Selectively SAVE p 91 If a numerical calculation that...

Страница 226: ...asuring upon judgment GO NG or GO NG 9 3 Judging Calculation Results Make Calculation Settings Start Measurement Acquire Data Calculate Display Calculation Results Calculation Judgments Save Stop Measurement Stop Criteria Trigger Mode Stopcriteria not met Repeat Single Measurement repeats until stop criteria are met Measurement repeats until you click STOP Stop Criteria Met or Stop Criteria is GO ...

Страница 227: ...isting Data Select Exec When judging automatically after measurement Click START to start measurement Off Judgment is not carried out On Result will be NG Fail if judgment range is exceeded Any channel in which result was NG is shown in red GO Continue to the next process when within the threshold range PASS judgment NG Continue to the next process when outside of the threshold range FAIL judgment...

Страница 228: ...in red When the judgment result is GO The GO signal is output at the GO EXT OUT 1 external I O terminal MR8741 only When the judgment result is NG The NG signal is output at the NG EXT OUT 2 external I O terminal MR8741 only The NG judgment is asserted when any channel is judged as NG When the beeper is enabled a beep sounds when a result is out of the thresh old range 9 3 1 Display of Judgment Re...

Страница 229: ...ion Select To create a new folder to use as target select New Folder When LAN is set as the save destination New Folder setting is ignored and the folder named with the current date is created 4 Enter a save name if you want to use a different name Move the flashing cursor to the Save Name item Enter the save name default setting MEAS See 7 1 Adding Comments p 136 When LAN is set as the save desti...

Страница 230: ...um Ch1 No3 Maximum Ch2 No4 Minimum Ch2 V V V V 08 04 11 17 40 33 351 3 00078E 05 2 12000E 04 2 00000E 03 1 30000E 03 08 04 11 17 44 25 976 3 06078E 05 2 39996E 04 2 00000E 03 1 10000E 03 When calculation settings are as follows Calculation No 1 Maximum value of analog channel 1 Calculation No 2 Maximum value of analog channel 1 Calculation No 3 Maximum value of analog channel 2 Calculation No 4 Ma...

Страница 231: ...es the first instance is treated as the maximum value Minimum Value Minimum Obtains the minimum value of waveform data Time to Minimum Value Min Time Obtains the time s from the trigger point to the minimum value When there are two or more minimum val ue points the first point of the first wave form for which calculation was carried out is taken as the minimum value Period Frequency Obtains the ti...

Страница 232: ...ted The calculation is available even if the X Y composite waveform is not intended for display To enable area calculation specify the calculation range using the A B cursors Voltage axis or Trace on the waveform of each channel for X Y composition The area cannot be specified directly by A B cursors on the X Y waveform See About A B Cursor 6 1 Reading Measurement Values Using the A B Cursors p 11...

Страница 233: ... below the specified level after rising through it or vice versa Four Arithmetic Oper ations Calculation Performs arithmetic operations upon arbitrarily selected results of numerical calculations Time difference calcu lation Time Diff Obtain T s the time difference that passes be tween rises above or drops below the level speci fied for A and B waveforms Time difference T B waveform time where the...

Страница 234: ...9 5 Numerical Calculation Type and Description 222 ...

Страница 235: ...oot SQR Moving Average MOV Slide along the time axis Differential Calculus 1st deriva tive DIF 2nd derivative DIF2 Integral Calculus 1st integral INT 2nd integral INT2 Trigonometric functions SIN COS TAN Inverse Trigonometric functions ASIN ACOS ATAN Digital Voltmeter Unit PLC delay time shift PLCS Total 12 types Specified calculation between A B cursors Waveform calculations can be lim ited to da...

Страница 236: ...matically p 86 Start Measurement Acquire Data The instrument acquires data when the trigger criteria are met If triggering is not enabled the instrument acquires data when measurement is started Calculate Calculating appears on the screen Calculations are performed sequentially from No 1 to No 16 To interrupt calculations click STOP to abort Display Calculation Results Results are displayed on the...

Страница 237: ...ion Results Results are displayed on the Waveform screen p 228 Save Save calculation results as occasion demands Save SAVE The maximum record length that can be calculated is as follows To perform calculation for waveforms measured at longer record lengths save to files in sections at a range shorter than maximum record length reload to this instrument and then calculate When memory division is no...

Страница 238: ...ording length save a subset of the waveform that is shorter than the maximum recording length to a separate file load that file back into the instrument and then perform the calculation See 6 2 Specifying a Waveform Range A B Cursor p 122 10 2 Settings for Waveform Calculation p 227 Changing calculation settings while measuring Changes made to calculation settings while measuring are applied after...

Страница 239: ...tion See Waveform Calculation Example p 232 Whole Wave Applies calculations to the whole waveform default setting A B Wave Applies calculations to the data between A B cursors Calculation No Enter constants Constants must have been previ ously entered on the CONST p 230 Enter numerical values and symbols Enter calculation operators When selecting A B Wave specify the calculation range using the A ...

Страница 240: ... 231 6 As occasion demands Set auto saving p 86 7 Execute the calculations Applying Calculations to Existing Data At the Wave Calc sheet select Exec To calculate while measuring Click START to start measurement Calculation waveforms are displayed after loading waveforms 7 10 2 1 Displaying the waveform calculation results Example Waveform of the calculated absolute value of the waveform of CH1 Cal...

Страница 241: ...set to the calculation operator When calculation results overflow OVER The value that indicated by the A B cursor is not a correct value When Scale is set to Auto waveforms appear at the top or bottom edge of the screen This makes calculation result overflow obvious Operator Name Operator Name ABS Absolute Value DIF2 2nd Derivative EXP Exponent INT2 2nd Integral LOG Common Logarithm SIN Sine SQR S...

Страница 242: ... and select STATUS Wave Calc sheet 1 Move the flashing cursor to the No to be set as CONST 2 Select an entry method and enter the constant Setting range 9 9999E 29 to 9 9999E 29 See 7 1 3 Alphanumeric Input p 139 Defined constants are shown in the constant display of the calcula tion equation setting dialog 1 ...

Страница 243: ...5 Select the graph to be displayed When split screen Format item on the Status sheet is Dual or higher Move the flashing cursor to the Graph column and select the graph b Waveform color Upper and lower limits Displayed measurement units Display range setting method Calculation No To copy settings between Calculation Nos Click the calculation No 1 2 4 3 Graph to display 6 On Off Set On to display t...

Страница 244: ... the Equation column of No Z1 and then select Enter EQN A dialog is displayed for entering a calculation equation 4 When finished entry select Confirm The entered equation is displayed in the Equation field 5 Execute the calculations Click START to start measurement The calculation waveform is displayed after acquiring the input wave form It is convenient to set con stants beforehand on the CONST ...

Страница 245: ...div 100 points k is specified after a comma Ex To make Z1 the moving average of 100 points MOV Z1 100 Slides waveform data along the time axis SLI Moves along the time axis by the specified distance bi di k i 1 2 n k number of points to move 5000 to 5000 k is specified after a comma Ex To slide Z1 by 100 points along the time axis SLI Z1 100 Note When sliding a waveform if there is no data at the ...

Страница 246: ...OV Calculation formulas for the first derivative Point t1 b1 25d1 48d2 36d3 16d4 3d5 12h Point t2 b2 3d1 10d2 18d3 6d4 d5 12h Point t3 b3 d1 8d2 8d4 d5 12h Point ti bi di 2 8di 1 8di 1 di 2 12h Point tn 2 bn 2 dn 4 8dn 3 8dn 1 dn 12h Point tn 1 bn 1 dn 4 6dn 3 18dn 2 10dn 1 3dn 12h Point tn bn 3dn 4 16dn 3 36dn 2 48dn 1 25dn 12h b1 to bn calculation results h Δt Sampling Period Calculation formula...

Страница 247: ...oint t3 II3 I1 I2 h 2 I2 I3 h 2 II2 I2 I3 h 2 Point tn IIn IIn 1 In 1 In h 2 II1 to IIn calculation results Digital Voltmeter Unit PLC delay time shift PLCS Shifts the time by the amount of delay for the frequency PLC and NPLC set on MR8990 Digital Voltmeter Unit Since the Digital Voltmeter Unit obtains the average of the amount of time set for NPLC a waveform that is delayed by just a time that i...

Страница 248: ...10 3 Waveform Calculation Operators and Results 236 ...

Страница 249: ...ter 11 Opening the Memory Div sheet Select STATUS andthen Memory Div from the right click menu When using memory division synchronization between blocks may not be possible in the following conditions MR8740 only When using memory division the trigger output TRIG_OUT terminal output may output the Low level or output erratically in the following conditions MR8741 only The time axis range is 5 μs d...

Страница 250: ...red can be minimized Even if the Memory Division function is not used up to 16 blocks of data depending on the specified recording length can be saved to each block so that previously recorded data can be selected for display on the Waveform Screen See 6 8 Seeing Block Waveforms p 134 Operations available from the Memory Div sheet Normal Memory Division 1 2 3 4 5 6 Reference Block Display Block Th...

Страница 251: ...et the start block Move the flashing cursor to the Start Block item Set the block number at which to start recording Default setting 1 5 Set the Used Block number Move the flashing cursor to the Use Blocks item Set the number of blocks to use Default setting 1 Off Memory Division is disabled default setting On Memory Division is enabled About Recording When a fast timebase is selected display ing ...

Страница 252: ...Seeing Block Waveforms p 134 Off Reference Blocks are not displayed default setting On Reference Blocks overlay Display blocks on the display All Blks Off Set reference to all blocks to Off All Blks On Set reference to all blocks to On Ref On Off Set On or Off If On is selected the block frame of the selected block number is displayed as a green square Select a block Off The waveform of only the l...

Страница 253: ...n To be able to select the block you want to see click WAVE in the right click menu at the Wave form screen and switch Pos to Block See 6 8 Seeing Block Waveforms p 134 When displaying memory division blocks as a list blocks may have the same trigger times This occurs because the minimum resolution of the clock used by this unit is 1 128th of a second 7 8125 ms and measurement occurs dur ing this ...

Страница 254: ...waveform display is On When measuring with an 8970 FREQ Unit dead time is approximately 230 ms When measuring in integral value Count mode there are cases when the last data in the previous block remains in the first part of the block When tracking waveform display is Off the roll mode function cannot be used even when roll mode is enabled not Off When triggering occurs very often clicking STOP ma...

Страница 255: ...isplayed See 12 3 8 Emphasizing Analysis Results phase spectra only p 255 so when performing FFT analysis with the instrument connected to a sound level or vibration meter scal ing by dB can be set from the Channel Settings screen if you want to read values directly in calibrated units of measurement See Scaling p 262 Refer to the 17 2 3 FFT Function p 343 for FFT function specifications FFT Funct...

Страница 256: ... depending on trigger settings 1 Settings are the same as for the Memory function 2 Even after analysis save settings can be set manually Finished Recording Recording Starts Measure with New Settings Measure with Existing Settings Set as occasion demands Set FFT analysis p 245 START Calculation occurs after acquiring the waveform FFT calculation Set up input channels p 262 1 Set the screen layout ...

Страница 257: ... can be performed from the Waveform screen p 261 The FFT function can be selected at screens other than the file screen 12 3 Setting FFT Analysis Conditions Opening the Status sheet Select STATUS and then Status from the right click menu 12 3 1 Selecting the FFT Function Procedure 1 Move the flashing cursor to the function item the upper most column of the Settings window 2 Select FFT ...

Страница 258: ...ship Between Frequency Range Resolution and Number of Analysis Points p 248 New Data Acquire a new waveform for analysis From Memory Calculates data measured using the memory function Procedure To open the screen Right click and select STATUS Status sheet See To set from the Waveform screen p 261 When the input data Reference is From Memory Analysis is performed until the specified number of FFT a...

Страница 259: ...oints p A15 12 3 3 Setting the Frequency Range and Number of Analysis Points When the Reference is From Memory the frequency is automatically set The setting cannot be changed To control sampling by an external signal select External When the input data Reference is From Memory The frequency range is set automatically when analysis is started 1 Set the number of FFT analysis points Move the flashi...

Страница 260: ...0 100 ms 4 250 ms 2 500 ms 4 k 10 k 10 ms 100 μs 10 100 ms 5 200 ms 2 500 ms 1 1 s 2 k 5 k 20 ms 200 μs 5 200 ms 2 5 400 ms 1 250 ms 500 m 2 s 800 2 k 50 ms 500 μs 2 500 ms 1 1 s 400 m 2 5 s 200 m 5 s 400 1 k 100 ms 1 ms 1 1 s 500 m 2 s 200 m 5 s 100 m 10 s 200 500 200 ms 2 ms 500 m 2 s 250 m 4 s 100 m 10 s 50 m 20 s 80 200 500 ms 5 ms 200 m 5 s 100 m 10 s 40 m 25 s 20 m 50 s 40 100 1 s 10 ms 100 ...

Страница 261: ... the thinning amount Move the flashing cursor to the Save Thin item Select Off Do not thin out default setting 1 10 Skip every 10 data points 1 100 Skip every 100 data points 1 1000 Skip every 1000 data points Procedure To open the screen Right click and select STATUS Status sheet 1 2 The Save Thin setting can only be set when the Reference is set to From Memory The range that can be set for thinn...

Страница 262: ...tion coefficient percentage Move the flashing cursor to the Attenuation rate item Set the attenuation coefficient as a percentage 3 Set attenuation correction Move the flashing cursor to the Compensation item Select Rectangular default setting Hanning Hamming Blackman Black man Harris Flat top Exponential None Attenuated window function values are not corrected default setting Power The window fun...

Страница 263: ...ter than that of the adjacent points that data is considered a local maxima The ten largest local maxima are displayed Maximam global maxima Among all data values the ten points with the greatest values are displayed Procedure To open the screen Right click and select STATUS Status sheet Maximal Maximam 2 3 2 4 5 6 1 1 No display occurs if peak values cannot be detected Peak values on the Waveform...

Страница 264: ...Linear Frequency Frequency domain waveforms are summed and aver aged and then the calculation result is output Expo Frequency The exponential mean of frequency domain wave forms is determined and then the calculation result is output Peak Frequency The maximum value of frequency domain waveforms is retained Procedure To open the screen Right click and select STATUS Status sheet About averaging cal...

Страница 265: ...ization However if the characteristics of the input waveform allow triggering using the trigger for synchro nization is recommended Spectrum peak hold After performing FFT calculations on the acquired waveform peak values are retained held and displayed within the frequency range z Settable Cannot be set O Partially settable Analysis Mode Averaging Waveform Averaging Spectrum Averaging Simple Expo...

Страница 266: ...eria met Input Signal Awaiting Trigger Waveform acquisi tion specified no of points Averaging Display 3 FFT analysis Spectrum averaging Waveform averaging 1 Awaiting trigger continues until the specified count is reached 2 Measurement stops automatically when the specified count is reached If measurement was interrupted by clicking STOP the averaging result up to that point is displayed 3 If Refer...

Страница 267: ...at exceeds that value multiplied by rate R can be dis played with emphasis 12 3 8 Emphasizing Analysis Results phase spectra only Power Spectrum Phase Spectrum Emphasis Display 10logPmax dB 10logRPmax dB Attenuation Rate and Value Attenuation value A dB Attenuation rate R A 10log10R 1 x 10 6 R 1 0 A 60 1 Enable the highlighting function Move the flashing cursor to the Highlight phase item Select 2...

Страница 268: ...the dialogs or copied from another Analysis No p 158 Analysis Type 1 2 Analysis Setting Contents Channel for Analysis 3 4 5 Display Color X Y Axes Display Parameter Off No analysis default setting Storage Waveform p 271 Histgram p 271 Linear Spectrum p 272 RMS Spectrum p 273 Powre Spectrum p 275 Powre Spectrum density p 276 LPC density p 277 Transfer Function p 278 Cross Power Spectrum p 279 Impul...

Страница 269: ...e phase of Ch1 2ch FFT Calculates the phase difference between Ch1 and Ch2 LPC dencity Order 2 to 64 Larger numerical values make finer spectrum compo nents visible Lin Mag Analysis results are displayed as amplitude values Log Mag Analysis results are displayed as dB values The dB reference is 1 eu As a voltage example 1 V is 0 dB Lin Real The real number component of analysis results are dis pla...

Страница 270: ... for analysis Spec tral components outside of the octave band are totally ignored z Settable Unsettable Analysis Mode X axis Y axis Nyquist display Linear Log Lin Mag Log Mag Lin Real Lin Imag OFF Storage Waveform z z Histogram z z Linear Spectrum z z z z z z z RMS Spectrum z z z z z z Power Spectrum z z z z Power Spectrum Density z z z z LPC analysis Power Spectrum Density z z z z Transfer Functi...

Страница 271: ...ted Linear spectrum RMS spectrum power spectrum The distortion rate calculates the cursor position as the fundamental wave When 2 cursors appear the A cursor becomes the fundamental wave When calculation results cannot be obtained is displayed Note that distortion rate values may become higher depending on the window function settings THD Σ fn 2 f0 2 100 f0 fundamental wave fn n next higher harmon...

Страница 272: ...item Set the upper and lower limits to display the analysis results Setting range 9 9999E 29 to 9 9999E 29 with exponent from E 29 to E 29 See 7 1 3 Alphanumeric Input p 139 Auto Scaling of the vertical y axis is automatically set according to analysis results default setting Manu al Scaling of the vertical y axis can be set as desired to suit the pur pose of the measurement This is useful for mag...

Страница 273: ...re trigger Select the trigger mode and pre triggering same as fo the Memory function Trigger Mode Single Repeat Auto Pre trigger Select from list See 8 2 Setting the Trigger Mode p 187 8 9 Pre Trigger Settings p 200 Number of Analysis Points p 247 1000 2000 5000 10000 Frequency Resolution dur ing acquisition Select the frequency range 133 mHz to 8 MHz p 247 FFT Window Function Type p 250 Setting m...

Страница 274: ...ting Channels Without Scaling With Scaling 5 4 1 2 3 Sound Level Meter 93 5 93 5 1 Select Num 2 Select Ratio 3 Move the flashing cursor to Ratio and click dB Scaling The dB Scaling dialog appears 4 Enter the overall value 6 51 displayed on the instrument 5 Enter the value 93 5 from the sound level meter that you want to read directly 6 Click Confirm to perform scaling Scaling is performed automati...

Страница 275: ...oss power spectrum the FFT calculation result is displayed in Nyquist display on one screen If the calculations have multiple settings waveforms are overlaid Dual Nyquist If the analysis mode is linear spectrum transfer function or cross power spectrum the FFT calculation result is displayed in Nyquist display on two screens If the calculations have multiple settings waveforms are displayed for ea...

Страница 276: ...is Linear and logarithm X axes cannot exist in one graph NG X unit Set Format and increase the number of screen divisions Different horizontal axis units cannot coexist in 1 graph NG EXT Analysis mode cannot perform external sampling Standard Nyquist Running Spectrum Single Standard Dual Standard Single Nyquist Dual Nyquist Running spectrum Reference setting New Data From Memory New Data From Memo...

Страница 277: ... click and select STATUS Status sheet 1 2 Running spectrum can only be set when the Reference is New Data The calculation interval time interval of the running spectrum waveform and the waveform is not regulated Averaging cannot be used Calculations that can be analyzed by running spectrum are limited to the fol lowing When other calculations are selected or calculation settings are changed after ...

Страница 278: ...nt is finished read the values of each waveform by cursor The older the waveform the larger the number 1 Click WAVE in the right click menu 2 Select a waveform Rotate the mouse wheel to select the waveform The waveform number is displayed in the lower right of the screen 3 Move the cursor Click AB CSR in the right click menu and rotate the mouse wheel to read the cursor value ...

Страница 279: ... the grid display Each click changes the display format Grid Type 2 1 Click WAVE in the right click menu 2 Move the flashing cursor to the Display 3 Change the number of waveforms to be displayed Clicking either or adjust the number of waveforms to be displayed Changing the number of waveforms to be displayed The number of waveforms to be displayed can be changed The following number of waveforms ...

Страница 280: ... The size of saved files depends on the save format and analysis method See Appendix 2 1 Waveform File Sizes p A2 When FFT Analysis Results are Saved as Text Divide files by calculation item and then save Text Saving Example 12 6 Saving Analysis Results Line 1 Title comment Lines 2 to 3 Trigger Time Calculation information X axis data Y axis data ...

Страница 281: ...er of analysis points beginning with the speci fied starting point and ending with end of waveform data and final analysis results are displayed Calculation is performed for the number of specified points so a good end point becomes the final analysis result Verifying the analysis starting point while viewing analysis data 12 7 Analysis with the Waveform Screen 12 7 1 Analyzing after Specifying an...

Страница 282: ...ion If Exec is Single in the setting items at the right side of the screen only the cal culation range currently displayed can be calculated For settings other Single calculation points are calculated until the final data To stop mid way click STOP Analysis Segment Display 6 Select analysis conditions as occasion demands The analysis segment of the memory waveform for one pass is displayed Memory ...

Страница 283: ...responding to the set frequency range See Relationship Between Frequency Range Resolution and Number of Analysis Points p 248 Y axis Lin Mag Displays the input module waveform Window Rectangular X axis Linear Y axis Lin Mag Histogram Acquires the amplitude distribution of the input signal Main uses To inspect deviations in the amplitude range of a waveform With analysis point distribution to ascer...

Страница 284: ...l number component of analysis values are displayed linearly Y axis Lin Mag Analysis values are displayed linearly Log Mag Analysis values are displayed as dB values 0 dB reference value 1eu Lin Real The real number component of analysis values are displayed Lin Imag The imaginary component of analysis values are displayed Nyquist display The imaginary component of analysis values are displayed eu...

Страница 285: ...quency axis waveform of the input signal RMS and power spectra displays use the same analysis results displayed logarithmically amplitude in dB Main uses To inspect the execution value of the frequency component of the waveform To inspect the RMS value at each frequency See About the Functions 12 8 2 Analysis Mode Functions p 289 Axis Display Type Description X axis Linear Frequency is displayed w...

Страница 286: ... axis Lin Real Normal display X axis Log Y axis Lin Imag Lin Imag If the cursor is displayed the total harmonic distortion THD which sets the fun damental wave as the cursor position is displayed When two cursors appear A cursor is the fundamental wave When results cannot be obtained is displayed ...

Страница 287: ...logarithm interval Y axis Lin Mag Analysis data is displayed linearly as squared values Indicates the power com ponent Log Mag logarithm Analysis values are displayed as dB values 0 dB reference value 1eu2 eu engineering units that are currently set are the standard e g when the unit settings is volts 0 dB 1 V2 Normal display X axis Log Y axis Lin Mag Normal display X axis Log Y axis Log Mag If th...

Страница 288: ...Functions 12 8 2 Analysis Mode Functions p 289 Axis Display Type Description X axis Linear Frequency is displayed with equal spacing Log Frequency display of logarithm interval Y axis Lin Mag Analysis values are displayed linearly Log Mag logarithm Analysis values are displayed as dB values 0 dB reference value 1eu2 Hz eu engineering units that are currently set are the standard e g when the unit ...

Страница 289: ...cing Log Frequency display of logarithm interval Y axis Lin Mag The analysis data is displayed linearly Log Mag logarithm Analysis values are displayed as dB values 0 dB reference value 1eu2 Hz eu engineering units that are currently set are the standard e g when the unit settings is volts 0 dB 1 V2 Hz X axis Log Y axis Lin Mag X axis Log Y axis Log Mag Always specify the order from 2 to 64 Higher...

Страница 290: ... Description X axis Linear Frequency is displayed with equal spacing Log Frequency display of logarithm interval Nyquist display Displays the real number component of the input output ratio Y axis Lin Mag Displays the input output ratio linearly dimensionless units Log Mag logarithm Displays the input output ratio as dB values Lin Real Displays the real number component of the input output ratio d...

Страница 291: ...t display Displays the real number component of the input output ratio linearly Y axis Lin Mag Displays the squared value of amplitude contents of analysis data linearly Log Mag logarithm Displays the amplitude contents of analysis data as dB values 0 dB reference value 1eu2 Lin Real Displays the squared values of the real component of analysis data linearly Lin Imag Displays the squared values of...

Страница 292: ...m is obtained Main uses To inspect circuit time constants See About the Functions 12 8 2 Analysis Mode Functions p 289 Linear Time Invariant Systems p A14 Axis Display Type Description X axis Linear Time display The center t 0 is the reference To the right is lag time t and to the left is lead time t Y axis Lin Mag This value is the transfer function provided by inverse Fourier transformation Norm...

Страница 293: ...r Frequency is displayed with equal spacing Log Frequency display of logarithm interval Y axis Lin Mag Displays the causal relationship and degree of relationship between two input signals as a value between 0 and 1 dimensionless units Normal display X axis Log Y axis Lin Mag With a single measurement the coherence function gives a value of one for all frequencies Spectrum frequency domain averagi...

Страница 294: ...ence between channels 1 and 2 See About the Functions 12 8 2 Analysis Mode Functions p 289 1 Ch FFT Displays the phase of the signal on channel 1 Displays the phase of a cosine waveform as a ref erence 0º Unless the waveform is synchronous phase values are unstable 2 Ch FFT Displays the phase difference between channels 1 and 2 Positive values indicate that the phase of channel 2 is leading Axis D...

Страница 295: ...alysis Mode Functions p 289 Axis Display Type Description X axis Linear Time display The center t 0 is the reference To the right is lag time t and to the left is lead time t Y axis Lin Mag 1 to 1 dimensionless units The closest correlation at time differential t is 1 and the least correlation is 0 1 indicates completely reversed polarity Because of the characteristics of the function t 0 becomes ...

Страница 296: ...of input and output sig nals is the closest and 0 when correlation is the least 1 indicates completely reversed polarity X axis Linear Y axis Lin Mag This instrument provides a circular cross correlation function Analysis results are normalized to the maximum value 1 1 and 1 3 Octave Analysis Analyze spectrums such as noise using fixed rate spectrum filters of 1 1 octave band or 1 3 octave band Ma...

Страница 297: ...IEC61260 standards With this instrument 1 1 and 1 3 octave analyses are calculated using power spectrum Analysis results 1 1 Octave Analysis 6 subbands 1 3 Octave Analysis 16 subbands The octave analysis results of this unit are displayed based on the oscillation level as a reference Therefore when only sine waves are input the value doubles 3 01 dB versus the overall value To directly read by ene...

Страница 298: ...12 8 FFT Analysis Modes 286 Measurable Ranges with Octave Analysis Timebase Period s Sampling frequency Hz Frequency range Hz Center Hz 1 1 OCT 1 3 OCT frequency ...

Страница 299: ...12 8 FFT Analysis Modes 287 11 Chapter 12 FFT Function 12 1 1 OCT 1 3 OCT Timebase Period s Sampling frequency Hz Frequency range Hz Hz Center frequency ...

Страница 300: ...12 8 FFT Analysis Modes 288 1 1 OCT 1 3 OCT Timebase Period s Sampling frequency Hz Frequency range Hz Hz Center frequency ...

Страница 301: ...nts amplitude data Linear Spectrum RMS Spectrum Power Spectrum Power Spectrum Density LPC analysis Power Spectrum Density Abbr Spectrum approximation from Linear Predictive Coding See Linear Predictive Coding LPC p A25 Transfer Function Cross Power Spectrum Impulse Response Coherence Function Phase Spectrum Auto correlation Func tion Cross correlation Func tion 1 1 Ovtave Analysis Abbr 1 3 Ovtave ...

Страница 302: ...12 8 FFT Analysis Modes 290 ...

Страница 303: ...NG Setting the evaluation area Setting the wave form evaluation Setting the GO NG stop mode Measurement starts Executing waveform GO NG evaluation Create the evaluation area by using the eight types of commands Store the evaluation area in memory and after that store the data on the media on the File screen Disable waveform evaluation Return NG if any part of the waveform leaves the evaluation are...

Страница 304: ...ta is not captured while the evaluation is in progress Therefore data are not captured while the evaluation is in progress which means that the input signal is not being continuously monitored The time required for evaluation is on the order of 100 ms When performing evaluation and measurement concurrently the waveform is displayed and evaluated while measurement continues However please note that...

Страница 305: ...m evaluation mode and stop mode Waveform evaluation mode Stop mode Return NG if any part of waveform leaves evalua tion area GO Stop on GO result NG Stop on NG result GO NG Stop on GO or NG result Return NG if entire wave form leaves evaluation area GO Stop on GO result NG Stop on NG result GO NG Stop on GO or NG result ...

Страница 306: ... the bar cursor to select the desired file 4 Select Load 5 Select Exec 6 When no more changes need be made to the loaded settings press the DISP key to make the Waveform screen appear and then press the START key to initiate measurement To change the settings first change the contents then press the DISP key to make the Waveform screen appear and then press the START key to initiate measurement Se...

Страница 307: ...luation area in the internal memory 6 After setting the parameters for Waveform Judge setting and Stop Mode click DISP to make the Waveform display screen appear and then click START to initiate measurement 7 Save the evaluation area on the File screen if it s necessary See 4 2 Saving Data p 85 Only one waveform evaluation area is stored in internal memory For example when operation is changed fro...

Страница 308: ...uation Out Return NG if any part of the waveform leaves the evalua tion area All out Return NG if the entire waveform leaves the evaluation area exec Enable waveform evaluation edit Activate editor for setting up evaluation area Function FFT Function MEMORY 1 Move the flashing cursor to Waveform Judge 2 Select the setting from the GUI displayed on the screen ...

Страница 309: ...O or NG should be used to stop the recording The Auto Save function is only executed when interruption conditions are satisfied 13 4 Setting the GO NG Stop Mode Setting method Procedure Screen STATUS Select GO Stop recording on GO result NG Stop recording on NG result GO or NG Stop recording on GO or NG result 1 Move the flashing cursor to the position Stop Mode 2 Select the setting from the GUI d...

Страница 310: ...SS FAIL PASS PASS PASS FAIL PASS FAIL PASS PASS FAIL Measure ment halted Measure ment halted Continue Continue Measure ment halted Through Through Through Through Through Save Save Through Save Save Save Save Save Save Save Save Save In case of Single trigger mode and FAIL stop condition In case of Repeat trigger mode and PASS FAIL stop condition In case of Single trigger mode and PASS FAIL stop c...

Страница 311: ...GUI displayed on the screen and create the area that will be the ref erence for waveform judgment You can also use the mouse to create an area See 1 5 1 Mouse Operations p 22 3 Click Exit to terminate the editor 4 Serves to store the created area in memory 5 Save the evaluation area through the File screen or SAVE if necessary See 4 2 Saving Data p 85 Save and End Saves the created evaluation area...

Страница 312: ...rm screen Overlay capture Captures overlay waveforms shown on the Waveform screen after connecting the uppermost and lowermost positions with the same display color and filling in the resulting enclosed space When the waveforms are overlapping undisplayed portions of the waveforms cannot be rec ognized This option can be selected when an overlay has been drawn on the screen Memory seg mentation re...

Страница 313: ... a circle Instructions 1 Select Draw shape 2 Select the figure you wish to draw 3 Using the mouse move the mark to the origin of the figure 4 Selecting Set sets the current position as the origin 5 Moving the mark draws a figure between the origin and the mark 6 Selecting Set again accepts the figure and causes its color to change For straight lines the origin is set at the accepted position For o...

Страница 314: ...e parts of figures you don t need 5 Click Exit Erase to terminate the erase mode Clear all Clears the entire editor screen Select Clear all to clear the editor screen Clear select area Clears a specified rectangular area of the editor screen Instructions 1 Select Clear select area 2 Using the mouse move the mark to the origin of the area to be erased 3 Clicking Set sets the position as the origin ...

Страница 315: ...t Terminates the editor Select Exit to select storing evaluation area in memory and quit editor or quitting editor without storing evaluation area in memory If Exit is clicked without having done any editing or immediately after using the store command the editor is ter minated without confirmation Note The waveform loaded into the editor will be displayed in a different color than was set with th...

Страница 316: ...13 6 Editor Command Details 304 ...

Страница 317: ...e System screen Environment sheet to make system related settings System Environment Settings Chapter 14 See Chapter 16 External Control MR8741 Only p 333 Opening the Environment sheet Select SYSTEM and then Environment from the right click menu MR8740 MR8741 ...

Страница 318: ...lect Color Edit change the R red G green and B blue values of each item to change its color p 308 Beep Sound This function audibly indicates warnings and operating conditions by beep sounds Off No grid displayed Dotted Line Display a dotted line grid default setting Solid Line Display a solid line grid Time Display the time from the trigger point fixed units default setting Time 60 Display the tim...

Страница 319: ...recording length is completed and clicking it twice stops measurement immedi ately However this setting is provided to allow a single click of STOP to stop measurement Mouse Speed Sets the mouse movement speed Use the mouse to move the square while holding down the left button Moving it towards Min makes the mouse pointer move more slowly while moving it towards Max makes the pointer move more qui...

Страница 320: ...es of each item to change its color See 7 1 3 Alphanumeric Input p 139 Custom Color screen Select Color setting for each waveform Grid graticule color Colors of cursor A and B lines Color of numerical values Background color Background color of the Waveform screen Background color of the setting screen Evaluation area color Done Applies the settings Reset Reverts to the default settings ...

Страница 321: ... ment and a PC Accessing files on the instrument via FTP p 323 The instrument is equipped with an FTP File Transfer Protocol compliant with RFC959 serv er You can use a PC FTP client to transfer files to instrument media and perform other file opera tions Controlling the instrument by command communications p 328 You can control the instrument by creating pro grams and connecting to the command co...

Страница 322: ...ddress data may flow over the network 15 1 1 Making LAN Settings at the Instrument Things to Check Before Making Settings When Connecting the instrument to an Existing Network The host name and address of the instrument Host name up to 12 characters ____________ IP address ___ ___ ___ ___ Subnet mask ___ ___ ___ ___ Gateway Whether to use a gateway Yes No IP address when used ___ ___ ___ ___ The T...

Страница 323: ...d password fields blank Interface LAN Host Name This is a name that identifies the instrument on the network Assign a host name that is different from the names of all other devices This instrument does not support dy namic DNS the name that you set is not registered with a DNS server IP Address This is an address that identifies an individual device on a network Assign an address that is differen...

Страница 324: ...is recommended to employ the former method 1 to assign the static IP address to the instrument because the latter method 2 will make the setting configuration complicated and require additional work to verify the IP address assigned by the DHCP server As the figure below indicates install the router between the DHCP server and the instrument Contact your dealer or Hioki representative for more inf...

Страница 325: ...n Connecting to an Existing Network When Configuring a New Network with a PC and This Instrument Use specified IP address and connect to network To assign a name to the instrument make a setting for 1 Host Name Settings within same network 2 Set IP Address for this instrument 2 Set IP Address for this instrument 3 Set Subnet Mask 3 Set Subnet Mask Settings for connecting to other network Using gat...

Страница 326: ... from a PC by connecting the instru ment to a hub with LAN cable 100BASE TX cable 15 1 2 Connecting Instrument and PC With LAN Cable MR8740 Rear MR8741 Front LAN connec tor of block II LAN connec tor of block I 1 Connecting the Instrument to a Network Connecting the Instrument to a Hub Connection cable Use one of the following 100BASE TX straight through cable maximum length 100 m commercially ava...

Страница 327: ...23 15 5 Controlling the Instrument with Command Communications LAN p 328 2 Making 1 1 Connections Between the Instrument and a PC Connecting the Instrument to a PC Connection cable Use one of the following 100BASE TX crossover cable maximum length 100 m 100BASE TX straight through cable with crossover adapter maximum length 100 m 9642 LAN Cable option supplied with crossover adapter Connect to PC ...

Страница 328: ...plete the installation 15 2 Performing Remote Operations on the Instrument Use an Internet Browser Attempting to control the instrument simultaneously from multiple computers may result in unintended operation Use only one computer to perform remote operations Installing JRE 15 2 1 Making HTTP Settings on the Instrument 1 2 2 Procedure To open the screen Right click and select SYSTEM Interface she...

Страница 329: ...user name and password for authentication were set via System screen Inter face sheet See 15 2 1 Making HTTP Settings on the Instrument p 316 15 2 2 Connecting to the Instrument With an Internet Browser Start stop measurement p 318 Show remote control screen p 319 Get data from USB memory stick via FTP p 322 Enter a title comment p 322 Enter an analog channel comment p 322 Enter a logic channel co...

Страница 330: ... configuration on the screen To acquire measure ment data Click on Acquire binary Acquire text or To MSEXCEL under Acquire Measurement Data Get binary data Acquire data in binary format Get text data Acquire data in text format To MS Excel Forward data to Excel in MS EXCEL Able to create graphs etc When there is no measurement data No measurement data will be displayed 15 2 3 Operating the Instrum...

Страница 331: ...iCorder performs the same action is if the corresponding key on the unit was pressed However simultaneously activating more than one button is not possible The keys and controls on the instrument are active also during remote operation Remote Operation Remote Control Screen Operation panel Instrument display screen Operation panel Update screen Zoom in or out Set display update speed Available set...

Страница 332: ...ons Click Download card and memory data by FTP A list of folders is displayed For details on how to perform file operations see 15 3 3 Using FTP for File Operations p 326 Acquiring Instrument Memory Data from a Computer For details on each of the commands refer to the Instrument Communication Command Instruction Manual on the application CD 1 Save the data you want to acquire to a USB memory stick...

Страница 333: ...TA command If you want to acquire more values than that send the command in step 3 repeatedly The maximum number of data samples that can be acquired is the value acquired with the MAXPoint command Procedure 1 MEMory MAXPoint The number of data samples stored in the memory of the instrument is acquired Check that storage data exists 2 MEMory POINt CH A The output point of the storage data is speci...

Страница 334: ...in the instrument can be obtained and used only for the respective channel To open the screen Click Title Comment Analog Ch Comment or Logic Ch Comment on list of operations Enter a string in the comment input field and click the Setting button The comment string can be up to 40 characters long Entering a Comment Comment Setting Screen Analog Channel Comment Setting Screen Title Comment Setting Sc...

Страница 335: ... Files on the Instrument From a Computer Using FTP The FTP server of the instrument allows only one connection at a time More than one PC cannot access the server simultaneously If no command is sent from a PC for more than one minute after connecting to the FTP server the FTP may disconnect the PC Reconnect the FTP FTP operation will be interrupted when measurement is started Before inserting or ...

Страница 336: ...the User Name and Pass word items and enter suitable information See 7 1 3 Alphanumeric Input p 139 Authorization User Name and Password p 311 4 Apply the settings Move the flashing cursor to the Reset item Select Reflect Set The indication LAN was reconnected appears at the bottom of the screen Read Write File deletion and renaming are permitted Read Only File reading only is permitted This preve...

Страница 337: ...1 Making FTP Settings at the Instrument p 324 You can also enter the user name and password delimited by and in front of the normal IP address ftp Username Password instrument IP address Example When the user name is hioki and the password is 1234 Enter ftp hioki 1234 192 168 0 2 15 3 2 Using FTP to Connect to the Instrument USB memory stick Click to display the file stored on the media Authorizat...

Страница 338: ...button down Move the mouse pointer to the target destination and then release the button Minutes and seconds may not be reflected on the file stamp date of the file Right click a file in the FTP folder list and select Delete or Rename from the pull down menu 15 3 3 Using FTP for File Operations Downloading Files Deleting and Renaming Files On PC monitor Drag Drop 1 Right click 2 Click Files cannot...

Страница 339: ...load dialog 5 Click Open to display the confirmation dialog to proceed with installation And go on the procedure 6 Click Next to open the installation destination selection window Click the Browse button to change the installation folder 7 Click Next to start installation The program is now installed Before using the program review the READ ME text file In the Windows Start menu select Programs HI...

Страница 340: ...strument understands all three settings LF or CR LF Header Use for control of communications commands The Header item specifies whether to prefix headers to command response messages For more information about commands refer to the Communications operation manual on the supplied CD Command Port Port number The instrument uses the TCP IP protocol for communications TCP IP allows communicating devic...

Страница 341: ...t Move the flashing cursor to the Port Number item and enter the port number LF Send character code 0x0a CR LF Send character codes 0x0d and 0x0a Off Do not add a header to response data On Add a header to response data Procedure To open the screen Right click and select SYSTEM Interface sheet About port numbers Specify only the most significant 3 digits of the 4 digit port number If you specify 8...

Страница 342: ...ame Enter a name in the Name field and click the OK button You can enter any name A Connect To dialog appears 3 Make the connection settings 1 In Connect using select TCP IP Winsock 2 In Host address enter the IP address of the instrument 3 In Port number enter the port number specified in the Interface sheet About port numbers On the instrument only the most significant 3 digits of the 4 digit in...

Страница 343: ...ars 2 Click the Settings tab 3 Click the ASCII Setup button The ASCII Setup dialog appears 5 Make detailed settings 1 Check the Send line ends with line feeds and Echo typed characters locally check boxes 2 Click the OK button to return to the Properties dialog 3 Click the OK button to return to the HyperTermi nal window 6 Try sending a command Enter idn and press the Enter key A response is retur...

Страница 344: ...edure 1 Setting the LAN Communicator Select 2 Setting the data collection server Specify the IP address of the PC on which Model 9333 LAN Communicator is running to communicate with the instru ment The IP address is required to acquire data by using Model 9333 LAN communicator As necessary set LAN as the save destination on the File Save sheet 3 Apply the settings Move the flashing cursor to the R...

Страница 345: ...how to operate MR8741 using the external control terminals We use the term external control terminals generically to refer to all of the terminals External Control MR8741 Only Chapter 16 Opening the Environment sheet Select SYSTEM and then Environment from the right click menu ...

Страница 346: ...th 9 10 mm Button operation specified tool Flat blade screwdriver φ 3 mm shaft diameter 2 6 mm tip width Single strand Multi strand 10 mm Connection procedure 1 Push in the button on the connector with a flat blade screwdriver or other tool 2 With the button held in insert the cable into the cable connection hole 3 Release the button The cable is locked 1 2 3 EXT TRIG TRIG OUT GND SMPL GND NG OUT2...

Страница 347: ...nal Input Procedure Start Start measurement Is not affected by Start Action p 307 Stop Stop measurement Operations after measurement such as numerical calcula tions and automatic saving will be carried out Start Stop Start measurement on LOW level and stop measurement on HIGH level Abort Stop measurement immediately Operations after measurement such as nu merical calculations and automatic saving ...

Страница 348: ...lation or waveform calculation evaluation result is GO pass Value Evalua tion and Wave form Evaluation A LOW signal is output when both the value calculation and waveform evaluation result are GO pass Error Output a LOW level signal when an error occurs Busy A LOW signal is output when external start operation is disabled such as during startup and saving Trigger Output a LOW level signal while in...

Страница 349: ...ain output with voltage output active LOW Output voltage range HIGH level 4 0 to 5 0 V LOW level 0 to 0 5 V current value 15 mA Maximum input voltage 50 VDC 50 mA 200 mW HIGH 4 to 5 0 V LOW 0 to 0 5 V Output period HIGH 4 to 5 0 V LOW 0 to 0 5 V 1 ms 500 μs 500 μs Probe Calibration Active Probe Calibration Inactive GND GO OUT1 NG OUT2 10 kΩ 10 kΩ 5 V ...

Страница 350: ...e is set to Off tH tL t tH tL t 5 μs 5 μs 10 μs 50 ns 50 ns 100 ns 5 μs 5 μs 10 μs 50 ns 50 ns 100 ns Voltage range HIGH level 3 0 to 5 0 V LOW level 0 to 0 8 V Pulse width HIGH LOW level 50 ns or greater Response frequency 10 MHz or lower Maximum input voltage 0 5 to 7 V HIGH 3 0 to 5 0 V SMPL LOW 0 to 0 8 V 100 Ω 150 pF 5 V GND t t L t H t H 50 ns t L 50 ns t 100 ns 3 3 kΩ 5 V When a sampling si...

Страница 351: ...HIGH to LOW 16 2 4 Trigger Output TRIG OUT Signal Output Procedure Pulse After LOW level output the signal goes HIGH after a specified interval Level After the trigger is established a LOW level signal will be outputted during the waveform retrieval Output signal Open drain output with voltage output active LOW Output voltage range HIGH level 4 0 to 5 0 V LOW level 0 to 0 5 V current value 15 mA P...

Страница 352: ...whether the trigger event occurs on the rising edge of the waveform or the falling edge 5 Short circuit the EXT TRIG terminal and GND or input a HIGH level 3 0 to 5 0 V or LOW level 0 to 0 8 V pulse wave or rectangular wave to the EXT TRIG terminal A trigger event occurs on the rising or falling edge of the input waveform 16 2 5 External Trigger terminal EXT TRIG Signal Input Procedure Output sign...

Страница 353: ... 2 up to 2000 m 6562 ft ASL Operating temperature and humidity 0 to 40 C 32 to 104 F 20 to 80 RH non condensation Storage temperature and humidity 10 to 50 C 14 to 122 F 90 RH or less non condensation Temperature and humidity range for guaranteed accuracy 23 5 C 73 4 9 0 F 20 to 80 RH non condensation Period of guaranteed accuracy 1 year Product warranty period 3 year Isolation resistance and with...

Страница 354: ...tal axis Time axis 10 5 2 1 1 2 1 5 1 10 1 20 1 50 1 100 1 200 1 500 1 1000 1 2000 1 5000 1 10000 1 20000 Vertical axis Voltage axis 100 50 20 10 5 2 1 1 2 1 5 1 10 Variable display function 1 Specified by upper and lower limit values by displayed amplitude per division Scaling Automatic scrolling 10 1 100 1 1000 1 selectable for different attenuating probes Manual scrolling conversion ratio setti...

Страница 355: ...e Recording length Fixed recording length 25 50 100 200 500 1000 2000 5000 10000 20000 50000 div Adjustable recording length Can be set in units of divisions up to 80 000 div Continuous Screen and Printing Settings 1 2 4 8 or 16 screens Waveform Storage The most recent 80 000 divisions of measurement data is retained in internal memory Waveform Scrolling Left right scrolling by Jog and Shuttle kno...

Страница 356: ...fined threshold range Period Trigger A trigger period reference voltage level and period range are specified The period of the signal rising or falling through the specified level is measured and triggering occurs when the period is outside of the specified range Glitch Trigger Set voltage level and pulse width glitch width Triggering occurs when the signal pulse width is narrower than the specifi...

Страница 357: ... Saves the file adding a 4 digit number at the beginning of the file name Overwrite If a file with the same name exists overwrites the file Error If a file with the same name exists an error message will be displayed Selection of blocks to be saved Saves the selected blocks when dividing the memory Selection of channels to be saved Selects the channels to save measurement data calculation data Sup...

Страница 358: ...n range All range between A B cursor selections Calculation record length Up to 2 000 div Operators Four arithmetic operations absolute vales indexes common logarithms square root moving av erage differential primary secondary Integral primary secondary parallel displacement of time axis direction trigonometric function reverse trigonometric function integration time correction based on NPLC setti...

Страница 359: ...d waveform falls inside or outside the correspond ing area Evaluation modes Out NG fail if any part of the waveform falls outside the area All out NG fail if the entire waveform falls outside the area Evaluation stop conditions GO NG GO NG Printer output can be generated or the waveform can be saved when evaluation stops Using the automatic print function built into Model 9333 LAN Communicator Eva...

Страница 360: ... twice Stop action Click once or twice GUI section saving Off On External control erminals 2 Trigger control terminals EXT TRIG TRIG OUT External sampling input terminal EXT SMPL Remote control input terminal START IN1 STOP IN2 SAVE IN3 Evaluation output terminals GO OUT1 NG OUT2 Remote control 2 Select from among terminals for remote input START IN1 STOP IN2 SAVE IN3 START STOP START STOP ABORT P...

Страница 361: ... 50 50 50 500 50 5k 50 50 k 50 500 k 50 Hz 3dB Input type Unbalanced floating Input coupling AC DC GND Input resistance 1 MΩ 1 Input capacitance 30 pF 10 pF at 100 kHz A D resolution 12 bit Maximum sampling rate 20 MS s Input terminals Insulated BNC terminal Maximum input voltage 400 VDC Maximum rated voltage to earth 300 VAC DC between input channels and chassis and between input channels Measure...

Страница 362: ...midity 90 RH or less non condensating Operating environment Same as the host Memory HiCorder Dimensions Approx 106 mmW 19 8 mmH 204 5mmD 4 17 W 0 78 H 8 05 D Mass Approx 240 g 8 8 oz Option Ferrite clamp on choke 2 Effect of radiated radio fre quency electromagnetic field 2 f s max at 3 V m Effect of conducted radio fre quency electromagnetic field 2 f s max at 3 V Applicable standards Safety EN61...

Страница 363: ...200 400 800 2k 4k 8k 20k 40k Hz Automatic setting when the anti aliasing filter is ON Attenuation property at 1 5 fc 66 dB or higher Input type Unbalanced floating Input coupling AC DC GND Input resistance 1 MΩ 1 Input capacitance 30 pF 10 pF at 100 kHz A D resolution 16 bit Maximum sampling rate 1 MS s Input terminals Insulated BNC terminal Maximum input voltage 400 V DC Maximum rated voltage to ...

Страница 364: ...h 33 Vrms AC or 70 V DC between each input channel and enclosure between any two of input channels Anticipated transient overvoltage 330 V Based on EN61010 2 030 2010 30 Vrms AC or 60 V DC between each input channel and enclosure between any two of input channels Anticipated transient overvoltage 330 V Operating temperature and humidity In accordance with the specifications of Memory HiCorder in w...

Страница 365: ...se width 2 μs Pulse width mode Measurement ranges 500μ 1m 5m 10m 50m 100 ms div f s 20div Measurement accuracy 0 1 f s Measurement ranges 2 μ to 2 s Measurement resolution Integral values mode 2000LSB DIV f s 20 DIV Power frequency mode 100LSB DIV f s 20 DIV Except for Integral values mode and Power frequency mode 500LSB DIV f s 20 DIV Response time Less than 40 μs sampling interval of instrument ...

Страница 366: ...ry HiCorder in which the 8970 is installed Operating environment Same as the Memory HiCorder in which the 8970 is installed Applicable standards Safety EN 61010 EMC EN 61326 Class A Dimensions Approx 106W x 19 8H x 196 5D mm 4 17 W x 0 78 H x 7 74 D excluding projections Mass Approx 250 g 8 8 oz ...

Страница 367: ...0 m 500 m 1 2 5 10 A div Measurement accuracy 0 65 f s filter 5 Hz ON 0 85 f s filter 5 Hz ON for using with Model 9278 or 9279 RMS accuracy 1 f s DC 30 to 1 kHz 3 f s 1 kHz to 10 kHz Sine wave input filter 5 Hz ON Response time 100 ms rise 0 90 f s Crest factor 2 Temperature characteristic 0 075 f s C Frequency characteristic DC Coupling DC to 100 kHz 3 dB AC Coupling 7 Hz to 100 kHz 3 dB low cut...

Страница 368: ...minimum at 50 60 Hz and with signal source resistance 100 Ω maximum Low pass filter Off 5 50 50 50 500 50 5k 50 100k 50 Hz 3 dB Input type Unbalanced floating Input coupling AC DC GND Input resistance 1 MΩ 1 Input capacitance 30 pF 10 pF at 100 kHz A D resolution 12 bits Maximum sampling rate 1 MS s Input terminals Insulated BNC terminal Maximum input voltage 400 VDC Maximum rated voltage to earth...

Страница 369: ...Probe MR9321 01 Logic Probe 9327 Logic Probe Operating temperature and humidity Same as the host Memory HiCorder Operating environment Same as the host Memory HiCorder Storage temperature and hu midity Temperature 10 to 50 C 14 to 122 F Humidity 80 RH or less non condensating Dimensions Approx 106 mmW 19 8 mmH 204 5 mmD 4 17 W 0 78 H 8 05 D Mass Approx 190 g 6 7 oz Applicable standards Safety EN61...

Страница 370: ...2500 V Operating temperature and humidity ranges Same as the host Memory HiCorder Operating environment Same as the host Memory HiCorder Storage temperature and hu midity ranges 10 to 50 C 14 to 122 F 80 RH or less no condensation Dimensions Approx 106 mmW 19 8 mmH 196 5 mmD Approx 4 17 W 0 78 H 7 74 D Weight Approx 260 g Approx 9 2 oz Accessories Instruction manual when shipped alone Effect of ra...

Страница 371: ...voltage to earth 1000 V AC DC measurement category III 600 V AC DC measurement category IV between individual input channels and enclosure as well as between individual input channels Anticipated transient overvoltage 8000 V Operating temperature and humidity As per Memory HiCorder in which Model U8974 is installed Operating environment As per Memory HiCorder in which Model U8974 is installed Stor...

Страница 372: ...imum rated voltage to earth 33 V AC rms or 70 V DC between individual output channels and enclosure external I O terminals as well as between individual output channels Anticipated transient overvoltage 330 V Maximum output voltage 10 V to 15 V Amplitude setting range 0 V p p to 20 V p p setting resolution 1 mV DC offset setting range 10 V to 15 V setting resolution 1 mV Output impedance 1 Ω or le...

Страница 373: ... frequency amplitude and offset Sweep time setting range 10 μs to 1000 s setting resolution 10 μs Sequence length Output by connecting up to 128 steps Step control Ability to set an FG waveform sweep waveform or user waveform for each step Ability to set the number of loops for sweep waveforms or output time for FG and arbitrary wave forms for each step Hold settings ON OFF setting for each step O...

Страница 374: ...channels Anticipated transient overvoltage 330 V Operating temperature and humidity As per Memory HiCorder into which the MR8790 is installed Operating environment As per Memory HiCorder into which the MR8790 is installed Storage temperature and humidity 20 C to 50 C 4 F to 122 F 90 RH or less no condensation Dimensions Approx 106W 19 8H 196 5D mm 4 17 W 0 78 H 7 74 D excluding protrusions Mass Ap...

Страница 375: ...t protection 100 mA Output open self test switched for all 8 channels at once 5 μs max load capacity of 1000 pF pull up resistance of 1 kΩ Detected voltages High level 3 4 V or greater low level 1 6 V or less 5 ms or less logic open collector switching output open self test switching Temperature and humidity for guaranteed accuracy Product warranty period Guaranteed accuracy period Operating tempe...

Страница 376: ... I_GND 4 CH3 29 I_GND 5 CH4 30 I_GND 6 I_GND 31 I_GND 7 CH5 32 I_GND 8 CH6 33 I_GND 9 CH7 34 I_GND 10 CH8 35 I_GND 11 I_GND 36 I_GND 12 NC 37 I_GND 13 NC 38 I_GND 14 NC 39 I_GND 15 NC 40 I_GND 16 I_GND 41 I_GND 17 NC 42 I_GND 18 NC 43 I_GND 19 NC 44 I_GND 20 NC 45 I_GND 21 I_GND 46 I_GND 22 TEST2 DIN03 I 47 I_GND 23 TEST3 DIN02 48 I_GND 24 NC 49 I_GND 25 NC 50 I_GND Frame F_GND CH1 to CH8 Pulse ou...

Страница 377: ... repair cannot be per formed by customers Please contact your dealer or Hioki representative Maintenance and Service Chapter 18 To avoid damage to the instrument remove the USB memory stick before ship ping the instrument Part Life Fan Motor Approx 60 000 hours Power Source Approx 50 000 hours Electrolytic Capacitors Approx 45 000 hours The useful life of electrolytic capacitors varies greatly acc...

Страница 378: ... the instrument and LCD monitor An analog monitor VGA output cannot be used Use an LCD monitor with a DVI D digital output connector The monitor flickers Is there a source of interference nearby Are you using a special LCD moni tor Although extremely uncom mon flickering may be caused by incompatibility with the LCD monitor Move the cable away from the source of interference Use an ordinary LCD mo...

Страница 379: ...ations Malfunction Symptom Check Item or Cause Remedy and Reference If Saving is Not Possible Symptom Check Item or Cause Remedy and Reference If saving is not possible to the USB memory stick Is the storage media inserted properly Is the storage media formatted Is the remaining capacity of the storage media too low Has the number of files in the folder reached the limit 2 3 Recording Media Prepar...

Страница 380: ... 2 Select On Select Off for the groups of settings that you do not want to initial ize 3 Move the flashing cursor to the System Reset 4 Select Exec A confirmation dialog box appears 5 Select Yes To cancel initializing Select No Initialization is complete when System initialized appears Status Ch Trig ger Current settings in Status screen Channel screen and Trigger setting window Default setting On...

Страница 381: ...6 The file name already exists cannot save Change the file name 4 4 6 Renaming Files Folders p 105 17 The folder name already exists Change the folder name 18 Not enough free space in the folder to create file Either delete files in the saving destination folder or change to another saving destina tion 19 Folder not empty The folder is not empty be sure you want to delete 20 The maximum length of ...

Страница 382: ...ilable The Roll Mode cannot be used when Overlay is enabled 7 2 Displaying Waveforms During Recording Roll Mode p 143 51 Cannot use Pre Trigger The pre trigger function is not available when using external sampling Chapter 16 External Con trol MR8741 Only p 333 52 Cannot use Roll Mode Memory Divi sion If the waveform calculation function is used these functions cannot be used 10 1 Waveform Calcula...

Страница 383: ...gger setting 104 There is no data in the search target channel Select channels with measurement data in the search target 105 There is a block with no data in the search target channel Select blocks with measurement data in the search target 106 Some blocks are different in measure ment mode of unit from the others Blocks different in measurement mode cannot be searched 108 Some blocks are differe...

Страница 384: ...p 373 Procedure To open the screen Right click and select SYSTEM Init sheet 18 4 1 ROM RAM Check 1 Move the flashing cursor to the ROM RAM Check item 2 Select Exec The ROM RAM check starts The following checks are performed in the sequence shown Program ROM Address bus Backup RAM Work RAM Video RAM Storage RAM Do not turn the power off during the check The judgment results appear when the check fi...

Страница 385: ...ndition of the display Left click the mouse to change the screen The original screen reappears If the display screen seems ab normal request repairs Screen Changes Color check Red Green Blue Black White Gradiation check Red Green Blue Black White Color pattern Original screen 18 4 3 System Configuration Check Currently selected interface 1 Move the flashing cursor to the System Information item 2 ...

Страница 386: ... FILE to open the File screen 2 Double click the MR8740 MR8741 version update file in the list 3 When the file information appears check the information and then click Exec to start the version update Once you start the update do not turn the power off until it is finished A version update file is indicated with the icon If you cannot find a version update file refer to the next page Click Exec to...

Страница 387: ...in with USB1 Click Change Media on the right of the File screen and then click USB Stick in the displayed list Wrong folder is selected Check the address displayed at the top of the screen There is no problem if the address is USB1 HIOKI_MR8740 If the address does not begin with USB1 HIOKI_MR8740 Left click the part enclosed by a red line in the figure below until USB1 is displayed for the address...

Страница 388: ...es wipe it gently with a soft cloth moist ened with water or mild detergent 18 6 Cleaning Cleaning the Instrument and Input Modules Never use solvents such as benzene alcohol acetone ether ketones thinners or gasoline as they can deform and discolor the case ...

Страница 389: ...he lithium battery up from the circuit board and cut the two leads with a wire cutter 4 Remove the battery from the board 18 7 Disposing of the Instrument Lithium Battery Removal To avoid electric shock turn off the power switch and disconnect the power cord and connection cords before removing the lithium battery Keep batteries away from children to prevent accidental swallowing Battery may explo...

Страница 390: ...Disposing of the Instrument Lithium Battery Removal 378 Lithium Battery Removal 1 2 Lead Lithium Battery Screw Phillips screwdriver MR8740 MR8741 Lithium Battery 1 2 Screw Phillips screwdriver Circuit board ...

Страница 391: ...tem Environment Grid Doted Line Time Val Time Beep Sound Warn Auto Scal On File Save Auto Save Off Interface Interface LAN IP Address 192 168 0 2 Channel Unit List Wave_Disp analog Color 1 16 Wave_Disp Logic Off Logic Width Normal Range Maximum sensitivity Coupling DC Scaling Disp Ratio Each channel Off Waveform Trigger settings window Trigger Mode Memory Auto Recorder Single PreTrigger Memory 0 T...

Страница 392: ... MB 3 1 MB 6 1 MB 10 000 1 000 001 1 9 MB 3 8 MB 7 7 MB 15 MB 31 MB 61 MB 100 000 10 000 001 19 MB 38 MB 76 MB 153 MB 305 MB 610 MB 1 000 000 100 000 001 191 MB 381MB 762 MB REC File Size Recorder Function Filesize setting size data size Calculation method REC File p A3 Recording length div Data Quanti ty Saved Channels 1 2 4 8 16 32 100 10 001 68 KB 107 KB 186 KB 345 KB 661 KB 1 3 MB 1 000 100 00...

Страница 393: ...n saving CSV text files longer than 2 GB are segmented into files of 2 GB each Recording length div Data Quantity Saved Channels 1 2 4 8 16 32 100 10 001 450 KB 723 KB 1 2 MB 2 3 MB 4 4 MB 8 7 MB 1 000 100 001 4 4 MB 7 1 MB 12 MB 23 MB 44 MB 87 MB 10 000 1 000 001 44 MB 71 MB 124 MB 231 MB 444 MB 872 MB 50 000 5 000 001 219 MB 353 MB 620 MB 1 1 GB 2 2 GB 4 3 GB MEM File File size bytes setting siz...

Страница 394: ...Number of FFT points 836 x Number of FFT calculation channels 4 Depending on the measurement conditions the file size may also increase or decrease from calculation formula result CSV Text File Memory Function File size bytes header size 1 data size 2 1 Header size 194 103 x saved analog channels saved logic channels 2 Data size 18 14 x saved analog channels 2 x logic channels x number of data Rec...

Страница 395: ...ing and image data files see the table below Appendix 2 2 Setting Configuration and Image Data File Sizes File Size Setting file 33 KB BMP No color compression 470 KB BMP Gray scale No compression 470 KB BMP B W No compression 59 KB BMP B W Reverse No compression 59 KB ...

Страница 396: ...hich case we cannot guarantee operation Memory Function Timebase Time div Sampling Rate Maximum Recording Length 160 000 div 5 μs 50 ns 0 8 s 10 μs 100 ns 1 6 s 20 μs 200 ns 3 2 s 50 μs 500 ns 8 s 100 μs 1 μs 16 s 200 μs 2 μs 32 s 500 μs 5 μs 1 min 20 s 1 ms 10 μs 2 min 40 s 2 ms 20 μs 5 min 20 s 5 ms 50 μs 13 min 20 s 10 ms 100 μs 26 min 40 s 20 ms 200 μs 53 min 20 s 50 ms 500 μs 2h 13 min 20 s 1...

Страница 397: ...n 40 s 100 ms 2 h 13 min 20 s 200 ms 4 h 26 min 40 s 500 ms 11 h 6 min 40 s 1 s 22 h 13 min 20 s 2 s 1 d 20 h 26 min 40 s 5 s 4 d 15 h 6 min 40 s 10 s 9 d 6 h 13 min 20 s 30 s 27 d 18 h 40 min 0 s 50 s 46 d 7 h 6 min 40 s 1 min 55 d 13 h 20 min 0 s 100 s 92 d 14 h 13 min 20 s 2 min 111 d 2 h 40 min 0 s 5 min 277 d 18 h 40 min 0 s 10 min 30 min 1 h Appendix 2 4 Maximum record length and number of d...

Страница 398: ... repeatedly during the data update rate period specified at NPLC See 7 9 8 Settings for the MR8990 Digital Voltmeter Unit p 169 Fixed record length The number of divisions blocks Maximum record length div 2 50 000 4 20 000 8 20 000 16 10 000 32 5 000 64 2 000 128 1 000 256 500 512 200 1024 100 Appendix 2 5 Time Axis Range and Sampling Rate of MR8990 Digital Voltmeter Unit Timebase div Sampling Rat...

Страница 399: ...rement Stress σ E 2 1 ν ε two gauge case For the four gauge case it is half of that Refer to the strain gauge instruction manual for combinations of strain gauges for each measurement Example Measuring Compressive Stress Using the one gauge method for an aluminum measurement object having a Young s modulus of 73 GPa according to the following Table σ 73 109 Measurement Value in με units 10 6 in με...

Страница 400: ...olution Unit 2 1 MS s 16 bits 400 V DC 300 V AC DC CAT II Model MR8990 Digital Voltmeter Unit 2 500 S s 24 bits 500 V DC 300 V AC DC CAT II RMS voltage measurements Model 8972 DC RMS Unit 2 1 MS s 12 bits 400 V DC 300 V AC DC CAT II Model U8974 High Volteage Unit 2 1 MS s 16 bits 1000 V DC 700 V AC 1000 V AC DC CAT III 600 V AC DC CAT IV Temperature Thermocouple measurements Model 8967 TEMP Unit 2...

Страница 401: ...c tion Cord Isolated BNC BNC 300 V AC DC Model 9322 Differential Probe For high voltage Following item is required for connection Voltage measurement with an input modulerequires the Model 9418 15 AC Adapter CAT II 2000 VDC 1000 VAC CAT III 600 VAC DC Model P9000 01 Differential Probe Model P9000 02 Differential Probe The Model Z1008 AC Adapter or a commercially available USB cable is required CAT...

Страница 402: ...sion Cable are required for connec tion Model 9272 10 Clamp On Sensor 20 A 200 A 1 Hz to 100 kHz Dedicated for AC Model 9018 10 Clamp On Probe 10 A to 500 A 40 Hz to 3 kHz Model 9132 50 Clamp On Probe 20 A to 1000 A 40 Hz to 1 kHz Leakage current Model 9657 10 Clamp On Leak Sensor 10 A AC Leakage current 50 Hz 60 Hz Others For connecting to a module for voltage measurement Model CT9555 CT9556 and ...

Страница 403: ...is func tion can be considered as a combination of sine waves at various frequencies such as in the following diagram The characteristics of a signal that may be diffi cult to analyze when viewed only as a waveform in the time domain can be eas ier to understand by transforming it into a spectrum the frequency domain Discrete Fourier Transforms and Inverse FFT _______________________ For a discret...

Страница 404: ...hen the input signal is given as a unit impulse the output is the LTI system characteristic itself The response waveform of a system to a unit impulse is called the impulse response On the other hand when the discrete Fourier transforms of x n y n and h n are X k Y k and H k respectively expression 7 gives the following H k is also called the transfer function calculated from X k and Y k Also the ...

Страница 405: ...analysis points is changed to N2 after measurement the instrument performs as follows 1 When N1 N2 Because not enough data has been collected zero is inserted for time after the end of the measured waveform The window function applies only to the N1 segment Frequency resolution is increased For example if N1 1000 and N2 2000 frequency resolution is doubled The average energy of the time domain wav...

Страница 406: ...nput includes a frequency component higher than fs 2 it is observed as a lower frequency alias that does not really exist The following diagrams show the results of spectrum analysis of composite waveforms having components of 1 kHz and 3 kHz and of 1 kHz and 7 kHz If sampling frequency fs is 10 kHz the spectral component of an input frequency above 5 kHz in this case 7 kHz is observed as an alias...

Страница 407: ...on a low pass filter can be used that cuts frequencies higher than one half of the sampling frequency Such a low pass filter is called an anti aliasing fil ter The following figures show the effect of application of an anti aliasing filter on a square wave input waveform Non existent frequency components are observed Without an anti aliasing filter Input time waveform Frequency analysis results Wi...

Страница 408: ...Resolution Unit To avoid imaging phenomena when analyzing waveforms with the FFT function verify the maximum sampling frequency of the input module before measuring Spectral Imaging Time domain waveform in the 8 MHz frequency range sampling frequency 20 MHz Spectrum The highest sampling frequency of the Model 8968 is 1 MHz so the same input data value is used for each block of 20 samples resulting...

Страница 409: ...surements to average An averaging results of n counts Zn measurement data of n counts Overall Value __________________________________________________ The overall value is the sum of the power spectrum at each frequency This value is equal to the positive sum of the squares of the RMS input signals except when frequency averaging is performed The FFT function of this instru ment calculates and dis...

Страница 410: ...d with FFT includes discontinuous points the spectrum is scattered and a line spectrum cannot be obtained This phenomena is called leakage error as shown below The window function was created to suppress such leakage errors The window function smoothly connects each end of the time domain waveform where it is cut off 14 dt t x f X ft π ε 2 Original Time Domain Waveform Waveform to be assumed with ...

Страница 411: ...ndow function having a wide main lobe is used when amplitude values are important while a window function having a small main lobe is used to observe fine spectral details and a window function having small side lobe amplitudes is used to exclude the effects of the surrounding spectrum However because the main lobe width is proportional to the width 1 W of the window increasing the number of analy...

Страница 412: ...form Spectrum Blackman Harris window Time Domain Waveform Spectrum N 1 0 Amplitude 0 0 1 50 99 9 Gain dB 0 2 4 6 8 10 80 60 40 20 0 Frequency 1 W 0 1 50 99 9 N 1 0 Amplitude 0 0 2 4 6 8 10 80 60 40 20 0 Frequency 1 W Gain dB N 1 0 Amplitude 0 0 2 4 6 8 10 80 60 40 20 0 Frequency 1 W Gain dB N 1 0 Amplitude 0 0 2 4 6 8 10 80 60 40 20 0 Frequency 1 W Gain dB ...

Страница 413: ...ow main lobe is able to separate and display both frequencies but a Hann window with a wide main lobe displays the two as a single spectral component Flat top window Time Domain Waveform Spectrum Analysis Using a Rectangular Window Analysis Using a Hann Window N 1 0 Amplitude 0 0 2 4 6 8 10 80 60 40 20 0 Frequency 1 W Gain dB 100 500 1000 5000 10000 100 50 0 Frequency Hz Amplitude dB 100 500 1000 ...

Страница 414: ... 下 限 Normalized Frequency f fm Normalized Frequency f fm Gain dB Sharp filter Normal filter Normal filter Class 1 and 2 lower limit Sharp filter Class 2 upper limit Class 1 upper limit Class 2 lower limit Class 1 lower limit Class 2 upper limit Class 1 upper limit 1 1 5 20 10 0 ク ラ ス 1 上 限 ク ラ ス 2 上 限 ノ ー マ ル フ ィ ル タ 規 格 化 周 波 数 f fm ゲイン dB ク ラ ス 1 下 限 シ ャ ー プ フ ィ ル タ ク ラ ス 2 下 限 1 2 3 4 5 6 7 8 9...

Страница 415: ...ted random variable with average value 0 and the dispersion Expression 15 shows how current sample value xt can be linearly predicted from previous sample values If the predicted value of xt is actually expres sion 15 can be transformed as follows Here αi is called the linear predictor coefficient For LPC analysis this coefficient is calculated using the Levinson Durbin algo rithm and a spectrum i...

Страница 416: ...Appendix 4 FFT Definitions A26 ...

Страница 417: ...n 281 Comment Print Channel marker 111 Communications 309 Access 324 Command Communications 328 Delimiter 329 Header 329 Command Port Port number 328 Deleting and Renaming Files 326 Delimiter 328 Downloading 326 Gateway 311 Header 328 Host Name 311 IP Address 311 Network 310 Subnet Mask 311 Connection Current Measurement 45 Frequency number of rotations and count Measurement 41 Temperature Measure...

Страница 418: ...gh Level 221 Highlight 255 Highlight phase db 255 Attenuation rate 255 Histogram 271 289 I Imaging A18 Impulse response 280 A14 Input Levels 130 Installation 7 Installing 7 Internal memory 52 Internet Browser 316 Invert 157 J Judge 215 Calculation Results Numerical Value 214 L L9197 Connection Cord 39 41 L9217 Connection Cord 39 41 LAN 310 Level monitor 130 Level Trigger 189 Linear predictive codi...

Страница 419: ... Length Data Samples 69 Rectangular A21 Rectangular Window 250 Ref Block Reference Block 240 Reference Junction Compensation 161 Replaceable Parts 365 Resolution 76 248 Rise Time 220 RJC 161 RMS Root Mean Square value 219 Roll Mode 143 Running spectrum 265 S Sampling Point 247 Sampling Rate 65 6 8 SAVE 91 Save Auto save 85 File type 83 Quick save 85 Saving is not possible 367 Selection save 85 Sav...

Страница 420: ...w 186 Trigger Source AND OR 204 Two Point Setting 146 U upper 113 Upper Lower limit 132 USB 52 Use Blocks 239 Used Block number number of blocks to use 239 V Variable Auto Adjustment 148 Variable function When setting combined use of scaling function 155 When setting scaling 148 Vernier 156 Voltage Sag Trigger 190 W Wave Binary 86 101 Wave color 256 Wave Display 240 Wave Text 86 101 Waveform Magni...

Страница 421: ......

Страница 422: ......

Страница 423: ......

Страница 424: ......

Отзывы: