Figure 27 illustrates a system setup for monitoring the PMD of an in-service link. The
signal is tapped before the demultiplexer, sent through an EDFA, and then the frequency
channel to be tested is separated out with a tunable filter and sent to the PMDPro.
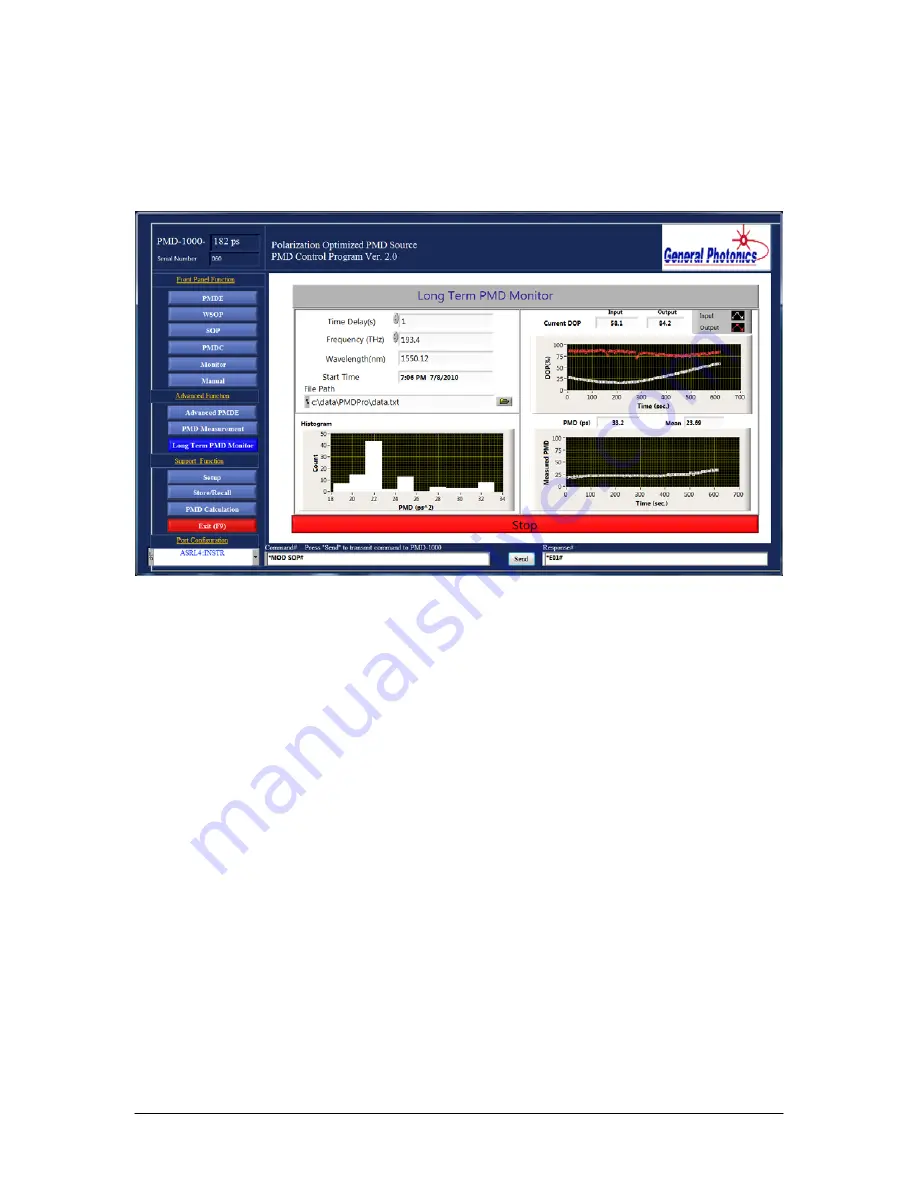
The picture above shows the control program interface screen for the long-term
monitoring function.
Connect the DUT to the input of the PMDPro.
Setup parameters:
File Path: Click the folder icon to select the file path to which the data should be
saved.
Time Delay: Time interval between measurements, in seconds.
Frequency: Frequency (in THz) of the signal to be measured. As this value is updated,
the corresponding wavelength (in nm) will be displayed in the box immediately
below the frequency box.
Once the setup is complete, click “Start” to begin recording data. The PMDPro will
perform PMD measurements at the specified time intervals. After each measurement is
complete, the PMDPro will record the following data to the file: optical head
temperature, optimized DGD (the DGD value for which the maximum output DOP was
found), input DOP, output DOP, and time stamp. The input and output DOP vs. time are
plotted on the top right hand graph, and the measured PMD vs. time is plotted on the
bottom right hand graph. The histogram tracks the distribution of measured PMD values.
Document #: GP-UM-PMD-1000-21
Page 87 of 122


