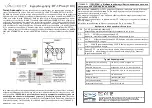
Scan DGD only:
This function scans through a user-defined DGD range with a fixed SOPMD value.
Selection parameters:
Start DGD: DGD start value, in ps
Stop DGD: DGD end value, in ps
DGD step: DGD step size, in ps
Fixed SOPMD: fixed SOPMD value, in ps
2
Scan Interval (on top of graph): dwell time per point, in s. Minimum value: 0.4 s.
When the scan parameters are set, click “Start” to start the scan. At each point in the scan,
the DGD, SOPMD, and maximum output DOP for that point are displayed above the
graphs, and the maximum output DOP vs. DGD is plotted in the graph on the left. The
maximum output DOP for the scan and the corresponding DGD and SOPMD values are
displayed below the graph.
After the scan is finished, the data can be saved to a file by clicking “SAVE DATA”.
Data is saved as a text file with 3 columns: DGD, SOPMD, and DOP.
Document #: GP-UM-PMD-1000-21
Page 81 of 122


