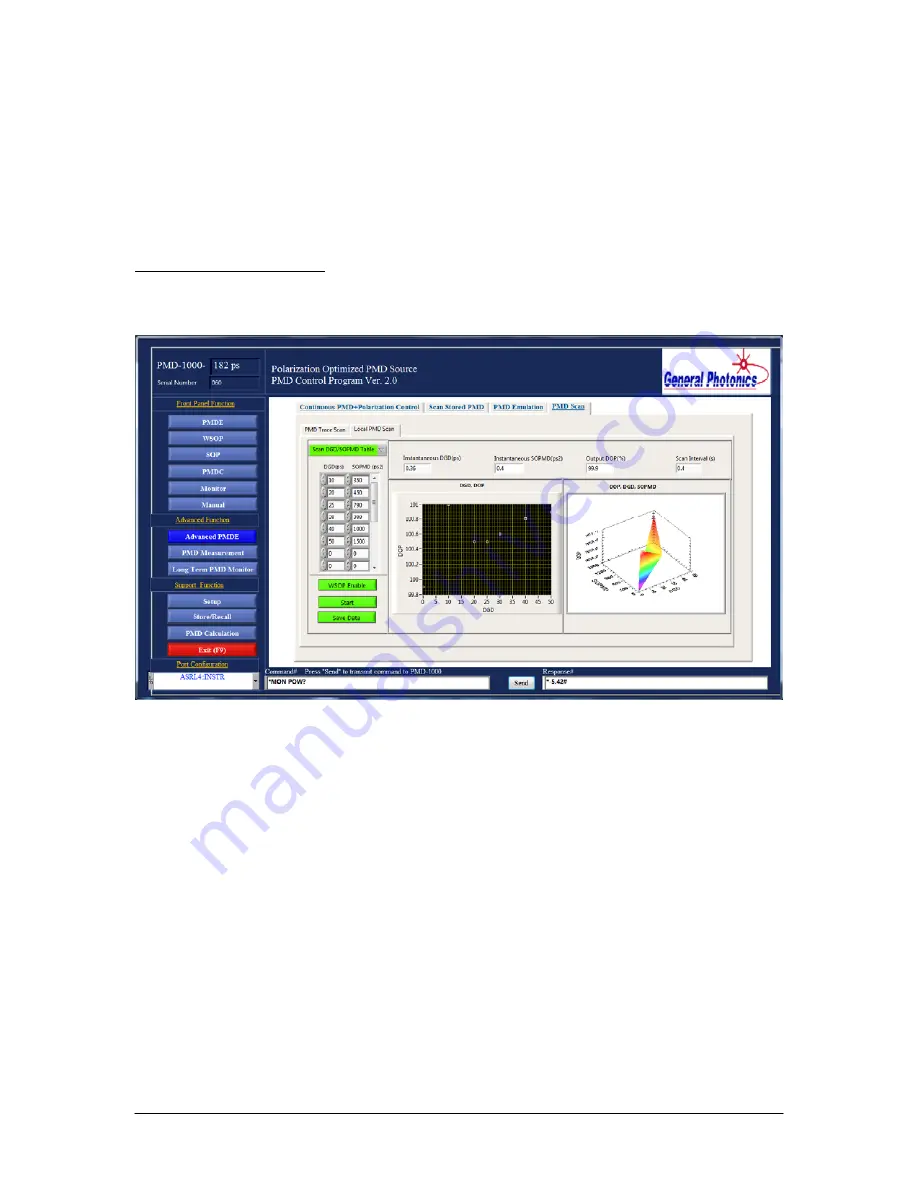
To rotate a 3D graph, drag it with the mouse. To zoom in or out, hover the mouse over it
and scroll up or down.
After the scan is finished, the data can be saved to a file by clicking “SAVE DATA”.
Data is saved as a text file with 3 columns: DGD, SOPMD, and DOP.
Scan DGD/SOPMD table:
This function scans through a set of user defined DGD/SOPMD pairs.
Enter the PMD values to be scanned in the table on the left of the screen. DGD values are
in ps and SOPMD values in ps
2
.
As in the other scan functions, the dwell time per point (Scan Interval, in s) should be set
in the box above the graph. The minimum value is 0.4 s.
When all of the PMD values are entered into the table, click “Start” to start the scan. As
each point is generated, the DGD, SOPMD, and output DOP are displayed above the
graph, and the output DOP vs. DGD is plotted in the graph on the left. The graph on the
right is a 3D graph of DOP vs. SOPMD and DGD. It can be rotated or zoomed for
viewing from different perspectives.
To rotate a 3D graph, drag it with the mouse. To zoom in or out, hover the mouse over it
and scroll up or down.
After the scan is finished, the data can be saved to a file by clicking “SAVE DATA”.
Data is saved as a text file with 3 columns: DGD, SOPMD, and DOP.
Document #: GP-UM-PMD-1000-21
Page 79 of 122


