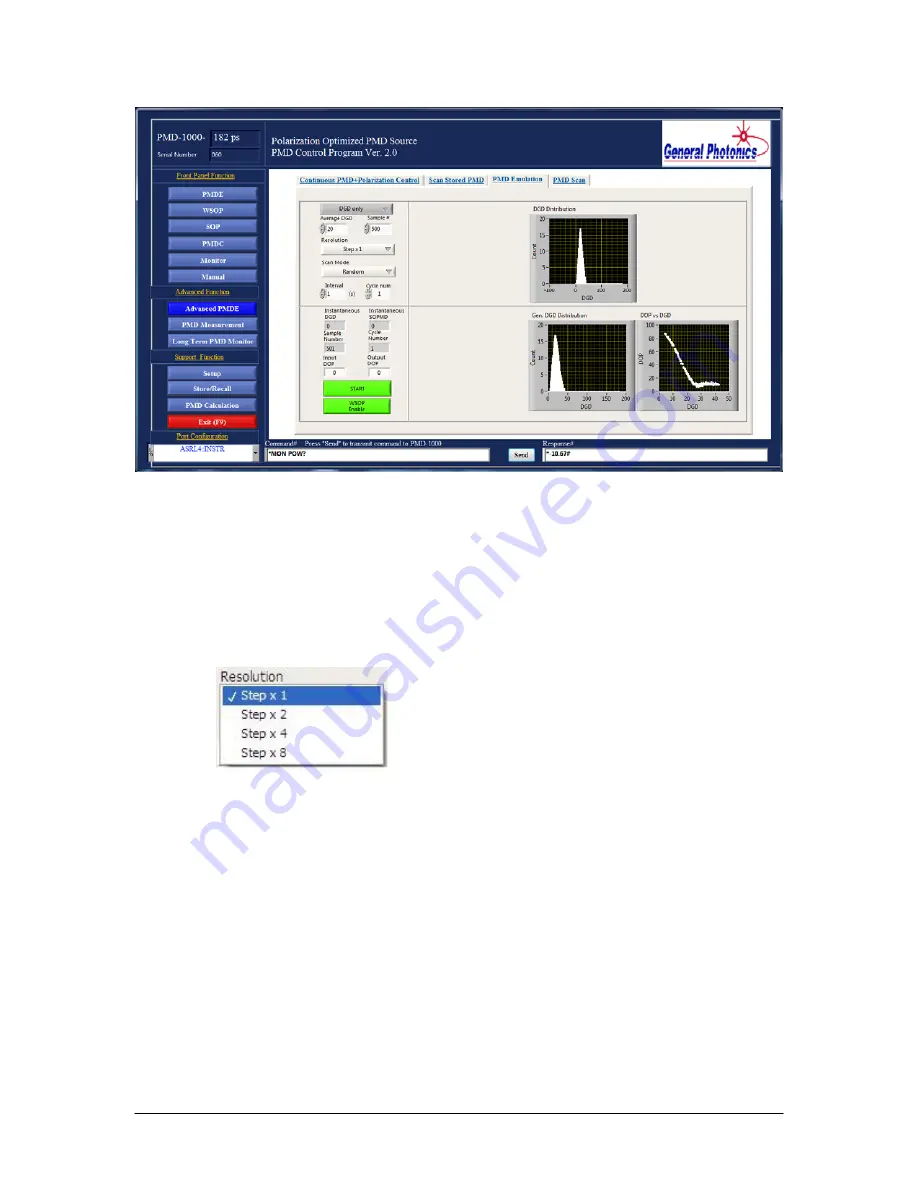
Selection parameters:
Average DGD: average DGD value (in ps) for the distribution.
Range: 0-30 ps for 90 ps PMDPro, 0-60 ps for 180 ps PMDPro.
Sample #: Total number of samples to be included in the distribution
Resolution: Minimum index number spacing between DGD values used in the scan.
For example, if the intrinsic DGD resolution of a 90 ps PMD-1000 is 0.357
ps, and the user chooses “step x2”, then the DGD resolution used for the scan
is 2 x 0.357 = 0.714 ps.
Scan Mode: Determines the order in which DGD values within the distribution will
be generated.
Random: DGD values are generated in random order.
Sorted: DGD values are generated in increasing order from lowest to highest.
Interval: dwell time (in s) per sample. Minimum value is 0.001s. However, data will
only be plotted for dwell times
≥
1s.
Cycle Num: Number of times to run the scan.
The DGD distribution plot shows the calculated distribution of DGD values that
corresponds to the selected parameters. This plot can be used to find a combination of
average DGD and sample number that will yield a good distribution.
If the dwell time per point (scan interval) is
≥
1 s, the program monitors the progress of
the emulation. As each point is generated, the status block at the lower left of the screen
Document #: GP-UM-PMD-1000-21
Page 69 of 122


