Super Systems Inc.
Page 68 of 107
Color Touch Screen Data Logger Operations Manual
SDS
View Real-time Data
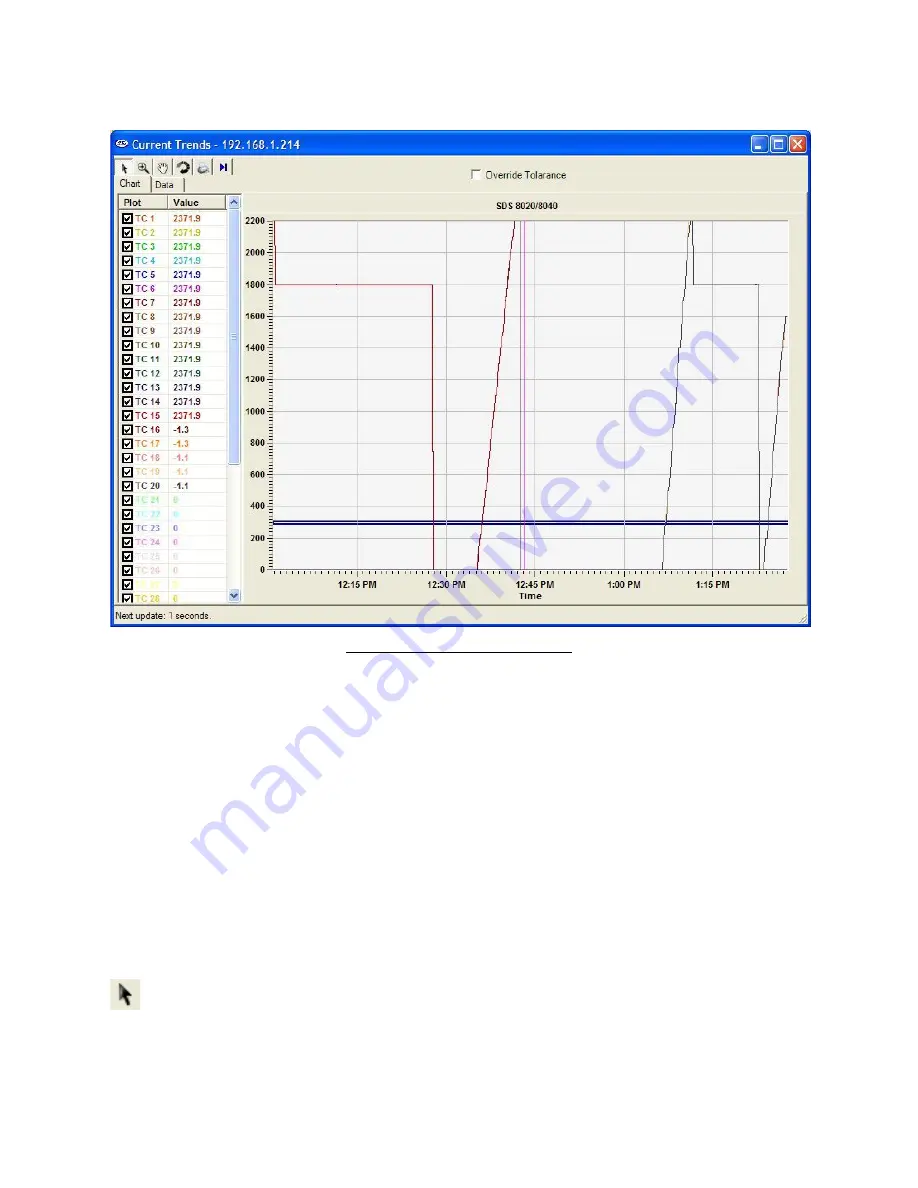
Figure 89 – Real-time Data screen
The View Real-time Data menu option will display the most current real-time data available.
This screen will update itself with the most current real-time data every 60 seconds. The
amount of time left until the next update will be displayed in the bottom left-hand corner of the
screen. When it does update, the software will connect to the SDS, download the data, and re-
draw the screen. Any screen settings, such as the size of the graph and how zoomed in the user
is, will not be changed. Note: If the Multiple SDS Mode menu option is checked, then the SDS
software will display a device selection box that will allow the user to choose which device to
gather the real-time data from. If the Multiple SDS Mode menu option is not checked, then the
SDS software will gather real-time data from the first SDS device that it finds on the network.
Note: it is possible to view real-time data from more than one SDS instrument at a time. To
view multiple real-time data, click on the View Real-time data menu option again and select the
next SDS instrument. The Chart tab will display the real-time data as a graph, along with the
tolerance, displayed as 2 blue lines. The Data tab will display the real-time data in numerical
form. On the Chart tab, all of the buttons are available. On the Data tab, only the Print button is
available.
Cursor Button
This is the default cursor used on the screen. The user can select the various TCs to plot and
move the scrollbar on the left side of the screen up or down in order to see more TCs.


