Super Systems Inc.
Page 13 of 107
Color Touch Screen Data Logger Operations Manual
required parameters, the start survey process can be selected. This will timestamp the
selection and the data logger will log all channels that have been selected for logging.
The operator may receive deviation alarms depending on the current input and setpoint as well
as the alarm settings. The alarm will notify the operator when an input is outside the
plus/minus tolerance for the setpoint. The alarm information will display on the data logger
and show the number of channels above tolerance and below the tolerance. The survey
continues to run. It is simply providing the operator with the information on the display.
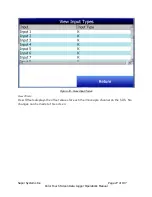
The operator can view the input channel data on a number of different screens. The
overview
display
will display all channels on the device.
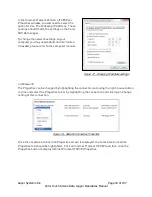
At any time, the operator can view the data in real time from the computer using the SDS
Reporter software. When selected, the real time data option displays data every 10 seconds.
The system will update the data in 10 second intervals every minute. Follow instructions for
connecting the data logger to the PC.
Figure 9 - Current Trends Screen (SDS Reporter)
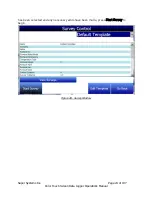
While the survey is running, several options are available: To stop the survey, select
Complete
Survey
from the Survey Control screen (which can be opened using the Survey option from the
main menu). Use
Mark Approach
to add a timestamp to the survey on when the furnace was
heating up to its target temperature. Use
Mark Survey Start
to mark when the survey began.
Figure 10 - Survey Control Window (visible from the data logger during a survey)


