


Chapter 3
96
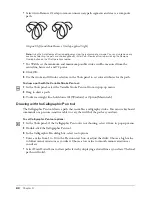
Overlapping fills
Closed paths have one of two directions: clockwise or counterclockwise. When a clockwise path
meets a counterclockwise path, these paths yield a transparent, overlapping section in a composite
path. When two closed paths of the same direction overlap, these paths yield a filled, overlapping
section. If your composite path’s overlapping fill does not behave as expected, try correcting its
direction, or subselect one path and reverse its direction.
To apply Correct Direction to a selected composite path, do one of the following:
•
Select Modify > Alter Path > Correct Direction.
•
Select Xtras > Cleanup > Correct Direction.
•
Click the Correct Direction button on the Xtra Operations toolbar.
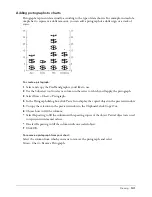
Creating charts and pictographs
Using the Chart tool, you can create charts to visually display numeric data. You create a chart by
entering data and choosing display options. You can later edit the data and change the display
options to update the chart.
A FreeHand chart is a grouped series of objects that acts much like any other group—you can
enlarge, scale, rotate, and move it, and you can also edit individual chart elements. Once you
ungroup a chart, however, it becomes a graphic and you can no longer edit the data, even if you
regroup the chart.
Pictographs are graphics that replace the standard chart bars or lines with an image. For example,
you can represent a monetary value with a stack of coins or a library value with stack of books.
Charts are created in grayscale. You can color them using various techniques.
To create a chart:
1
In the Tools panel, select the Chart tool from its pop-up menu.
2
Drag the pointer to set the initial size of the chart.
The Chart dialog box appears with the insertion point in the data entry text box. The active
cell is outlined in black.
To change the active cell, click a different cell or use the arrow keys.
3
Do one of the following to add data to the selected cell:
•
Type in the text box above the chart cells. To undo the last change, click the Undo button.
•
Click Import to import tab-delimited text from another application, such as Microsoft Excel.
4
To create labels and legends, leave the top left cell empty. Enter data across the first row for the
chart legend and in the left column for the labels.
Labels appear across the bottom of the graph and the legend appears at its right side. Type
quotation marks around number labels to have them read as numbers instead of data.
5
To transpose the rows and columns and their data, click the Transpose button.
6
To adjust column width, drag the triangle above the line separating two columns.
Summary of Contents for FreeHand MX
Page 1: ...Using FreeHand MX Macromedia FreeHand MX...
Page 42: ...Chapter 1 42...
Page 192: ...Chapter 6 192...
Page 232: ...Chapter 7 232...
Page 288: ...Chapter 8 288...
Page 308: ...Chapter 9 308...
Page 340: ...Chapter 11 340...
Page 362: ...Chapter 12 362...
Page 374: ...Chapter 13 374...
Page 388: ...Chapter 14 388...


