V&T Technologies Co., Ltd.
http://www.ecodrivecn.com
Chapter 6 Parameter Description
93
To adjust the analog outputs as defined in the above table, it can use this function. The adjusted analog
value is the actual output of AO terminal.
P7.09 is used to determine the positive and negative polarity of the gain or bias.
Display of operation panel
Unit place
AO1 gain 0: Positive; 1: Negative
Tens place
AO1 bias 0: Positive; 1: Negative
Hundreds
place
AO2 gain 0: Positive; 1: Negative
Thousands
place
AO2 bias 0: Positive; 1: Negative
Since function codes P7.05 ~ P7.09 are different from other function codes, adjustment will affect the AO
output timely.
Both AO1 and AO2 have the same calibration way. Take AO1 as an example:
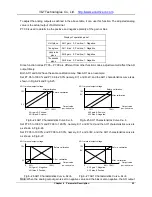
Set P7.05 to 100.0% and P7.06 to 20.0%,namely, K=1 and b=2V, and the AO1 characteristics curve is as
shown in Fig.6-24 and Fig.6-25.
10V
2V
0
Before calibration
After calibration
AO1 terminal output voltage
Output value
per-unit value
AO1 gain 0: Positive;
AO1 bias 0: Positive;
80% 100%
10V
8V
0
Before calibration
After calibration
Output value
per-unit value
AO1 gain 0: Positive;
AO1 bias 0: Negative;
20%
100%
AO1 terminal output voltage
Fig.6
−2
4 AO1 Characteristics Curve Kx+b
Fig.6
−2
5 AO1 Characteristics Curve Kx
−b
Set P7.05 to 100.0% and P7.06 to 120.0%, namely, K=1 and b=12V, and the AO1 characteristics curve is
as shown in Fig.6-26.
Set P7.05 to 100.0% and P7.06 to 80.0%, namely, K=1 and b=8V, and the AO1 characteristics curve is
as shown in Fig.6-27.
10V
2V
0
Before calibration
After calibration
Output value
per-unit value
AO1 gain 1: Negative;
AO1bias 0: Positive;
20%
100%
10V
8V
0
Before calibration
After calibration
Output value
per-unit value
AO1 gain 1: Negative;
AO1 bias 0: Positive;
80% 100%
AO1 terminal output voltage
AO1 terminal output voltage
Fig.6
−2
6 AO1 Characteristics Curve
−Kx+b
Fig.6
−2
7 AO1 Characteristics Curve
−Kx+b
Note: When the analog output gain is set to negative value and the bias is also negative, the AO output

