255
Introduction to the Control Module
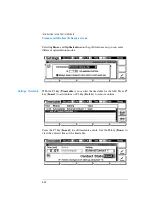
Screens available from the Analysis screen
Status
Press F5 key (
Views
) and select
Status
.
This is an example if an Agilent 1100 ALS is configured stand-alone.
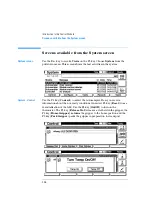
Signal plot
Press F6 key (
Plot
) to enter the plot screen (available also from the
Analysis
and
System
screen). Here you can observe the on-line signal(s). To add
additional on-line signals (maximum 3), press F6 key (
Select
). If more than
one signal is configured (see next), use the 1-2-3 number key to switch
between the signals.
Summary of Contents for G1313A
Page 1: ...s1 Agilent 1100 Series Standard Micro and Preparative Autosamplers Reference Manual ...
Page 3: ...Reference Manual Agilent 1100 Series Standard Micro and Preparative Autosamplers ...
Page 12: ...12 Contents ...
Page 39: ...2 2 Optimizing Performance How to optimize the autosamplers to achieve best results ...
Page 93: ...93 Troubleshooting and Test Functions Step Commands ...
Page 216: ...216 Introduction to the Autosampler Electrical Connections ...
Page 244: ...244 Theory of Operation The Main Power Supply Assembly ...
Page 265: ...265 Introduction to the Control Module Diagnostics and Tests ...
Page 268: ...268 Introduction to the Control Module Diagnostics and Tests ...
Page 274: ...274 Specifications Performance Specifications ...
Page 275: ...10 Legal Safety and Warranty Information ...
Page 286: ...286 Agilent Technologies on Internet ...
Page 290: ...290 Index ...
Page 291: ......


