Group Trend Display
Section 3 CCF Displays
66
3BUR002418-600 A
Group Trend Display
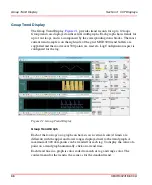
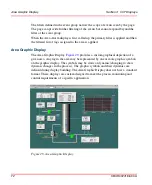
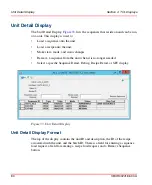
The Group Trend Display,
, provides trend records for up to 12 loops.
Group trends are displayed on three full-width graphs. Each graph shows trends for
up to four loops, and is accompanied by the corresponding status blocks. The most
current trend sample is on the right side of the grid. MOD 300 trend buffers are
supported and the most recent 300 points are read if a Log Configuration aspect is
configured for the tag.
Group Trend Graph
Each of the four tags on a graph can have its own vertical scale (if limits are
different) with the upper and lower ranges displayed next to the trend graph. A
maximum of 300 data points can be trended for each tag. To display the value of a
point on a trend graph numerically, click on a trend trace.
Each trend line in a graph is color coded to match its tag and range color. The
context menu for the trend is the same as for the standard trend.
Figure 21. Group Trend Display
Summary of Contents for Ability 800xA Series
Page 1: ...Power and productivity for a better worldTM 800xA for MOD 300 Operation System Version 6 0 ...
Page 2: ......
Page 3: ...800xA for MOD 300 Operation System Version 6 0 ...
Page 14: ...Table of Contents 14 3BUR002418 600 A ...
Page 74: ...Area Graphic Display Section 3 CCF Displays 74 3BUR002418 600 A ...
Page 102: ...Batch Connectivity to M0D 300 Section 4 TCL Displays 102 3BUR002418 600 A ...
Page 120: ...TLL Messages Section 5 TLL Displays 120 3BUR002418 600 A ...
Page 212: ...Viewing Abnormal State on MOD Loop Displays Section 8 Operation Examples 212 3BUR002418 600 A ...
Page 320: ...BRKPTS Appendix A Runtime Templates 320 3BUR002418 600 A ...
Page 322: ...Updates in Revision Index A 322 3BUR002418 600 A ...
Page 330: ...Index 330 3BUR002418 600 A ...
Page 331: ......

