
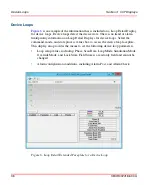


Viewing Trend Data
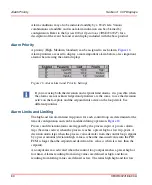
Section 3 CCF Displays
48
3BUR002418-600 A
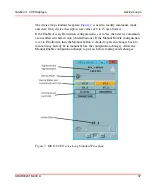
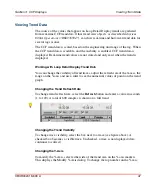
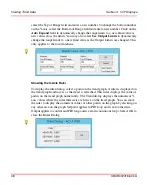
select the Top of Range field and enter a new number. To change the bottom number
on the Y-axis, select the Bottom of Range field and enter a new number. Click on the
Auto Expand
field to dynamically change the range limits to a new limit value as
new values cross the limits. You may also select
Use Output Limits
to dynamically
change the range limits to a new limit value as the Output Limits are changed. This
only applies to the local machine.
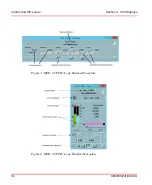
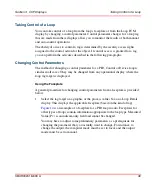
Showing the X-Axis Ruler
To display the ruler dialog, select a point on the trend graph. A ruler is displayed on
the trend graph and moves as the trend is refreshed. This ruler displays the value of
points on the trend graph numerically. The Trend dialog displays the numerical Y-
axis values where the ruler intersects each trace on the trend graph. You can move
the ruler to display the numerical values of other points on the graph by clicking on
any other area on the graph. Setpoint applies to PID loop and is zero otherwise.
Output applies to control and PID loop and is zero in continuous loops. Select OK to
close the Ruler Dialog.
Summary of Contents for Ability 800xA Series
Page 1: ...Power and productivity for a better worldTM 800xA for MOD 300 Operation System Version 6 0 ...
Page 2: ......
Page 3: ...800xA for MOD 300 Operation System Version 6 0 ...
Page 14: ...Table of Contents 14 3BUR002418 600 A ...
Page 74: ...Area Graphic Display Section 3 CCF Displays 74 3BUR002418 600 A ...
Page 102: ...Batch Connectivity to M0D 300 Section 4 TCL Displays 102 3BUR002418 600 A ...
Page 120: ...TLL Messages Section 5 TLL Displays 120 3BUR002418 600 A ...
Page 212: ...Viewing Abnormal State on MOD Loop Displays Section 8 Operation Examples 212 3BUR002418 600 A ...
Page 320: ...BRKPTS Appendix A Runtime Templates 320 3BUR002418 600 A ...
Page 322: ...Updates in Revision Index A 322 3BUR002418 600 A ...
Page 330: ...Index 330 3BUR002418 600 A ...
Page 331: ......