Chapter 5
Components
DME Designer Owner’s Manual
300
■
Graph
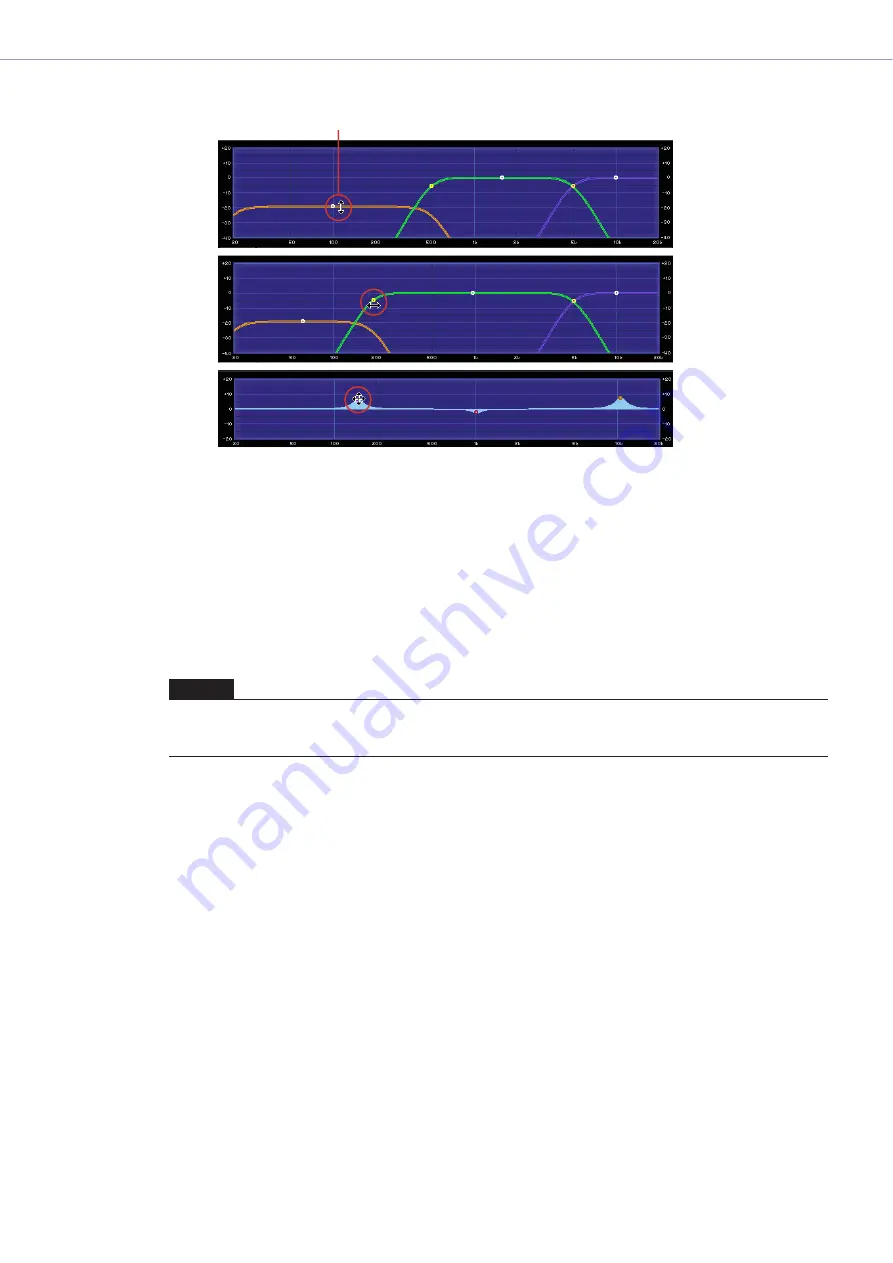
Displays parameters graphically. When parameters are changed, the graph also changes.
In graphs that have control points, you can adjust parameters by dragging the points. On graphs
with control points that are limited to movement in one direction only, aligning the mouse pointer
with the control point and pressing the mouse button causes the mouse pointer to change to a
double-headed arrow pointing in both directions of movement. Change the parameter by dragging
in the directions of the arrow.
Control points that can be dragged in any direction usually have their position determined by
multiple parameters in the component editor. These multiple parameters can be adjusted by
dragging the point.
When there are multiple control points in the graph, they are identified by their colors. A bar with the
same color as each control point can be found below the corresponding knob or edit box.
NOTE
When a graph that has control points is copied to the User Control Editor or User Module Editor, the controls points will
not be displayed. The controllers assigned to the corresponding parameters must also be copied to display the control
points.
Control Point


