CellAdvisor 5G User's Guide
165
Viewing the logging data
1
Load the saved logging file using the
Load
icon (
) on the side bar. Make sure the file extension is
. gomv
.
2
Tap to switch
Plot Item
to
RSRP
,
RSRQ
,
S-SS SINR
,
S-SS RSSI
,
P-SS RSRP
,
S-SS RSRP
,
S-SS Ec/Io
,
or
P-SS SNR
.
3
Tap the
Apply
button.
The point color of the map changes to the corresponding value, and if there is no detected LTE signal, the point will become
gray color.
NOTE:
When you load the result file, a pop-up message asking whether you want to load data only or data with map
appears. If the current screen does not display all the loaded data, the screen mode will be automatically changed
to Full.
Setting limit
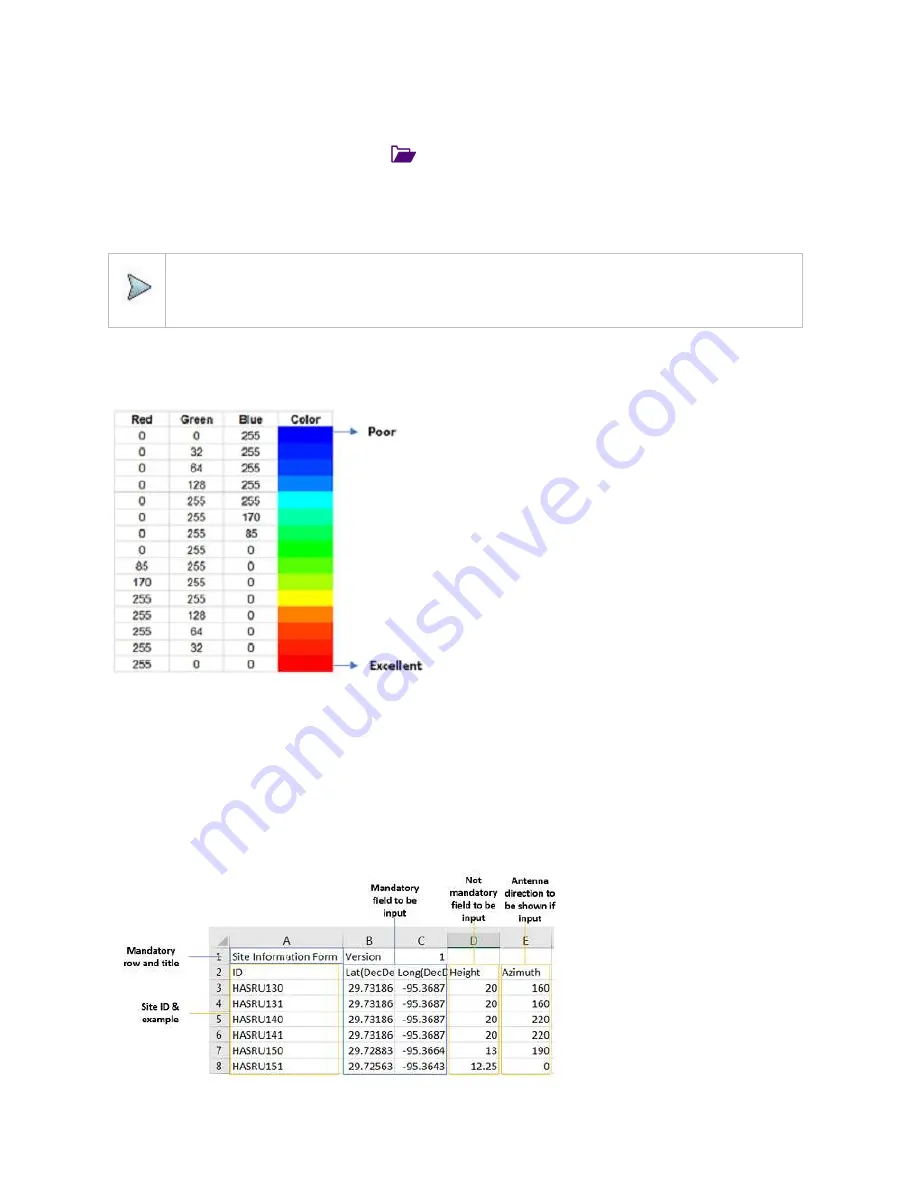
You can set the thresholds for the two different color indicators, red and blue. The maximum value in red is the Limit for
Excellent
,
and the minimum value in blue is the Limit for
Poor
. See below to check the plot point color based on the Legend Color Table.
1
Tap the rectangle with value before color legend bar on the right panel.
2
Set a value for
Poor
(minimum value) using the on-screen keyboard.
3
Tap the rectangle with value after color legend bar on the right panel.
4
Set a value for
Excellent
(maximum value) using the on-screen keyboard.
Importing cellsite DB
You can import the site DB by creating the 5G site information form.
1
Create the 5G site information with an excel file as below.
Содержание CellAdvisor 5G
Страница 1: ...1 CellAdvisorTM 5G User s Guide ...
Страница 2: ......
Страница 18: ......
Страница 22: ......
Страница 110: ......
Страница 146: ......
Страница 182: ...Using LTE LTE A TDD Analyzer 170 CCDF measurement with LTE LTE A TDD Analyzer ...
Страница 264: ......
Страница 312: ......
Страница 332: ......
Страница 338: ......
Страница 346: ...Using RFoCPRI Analyzer 334 Rx Settings with RFoCPRI Analyzer ...
Страница 352: ......
Страница 356: ...Appendix 344 ...
Страница 357: ...345 ...
Страница 358: ......


