


Change into the
NUM
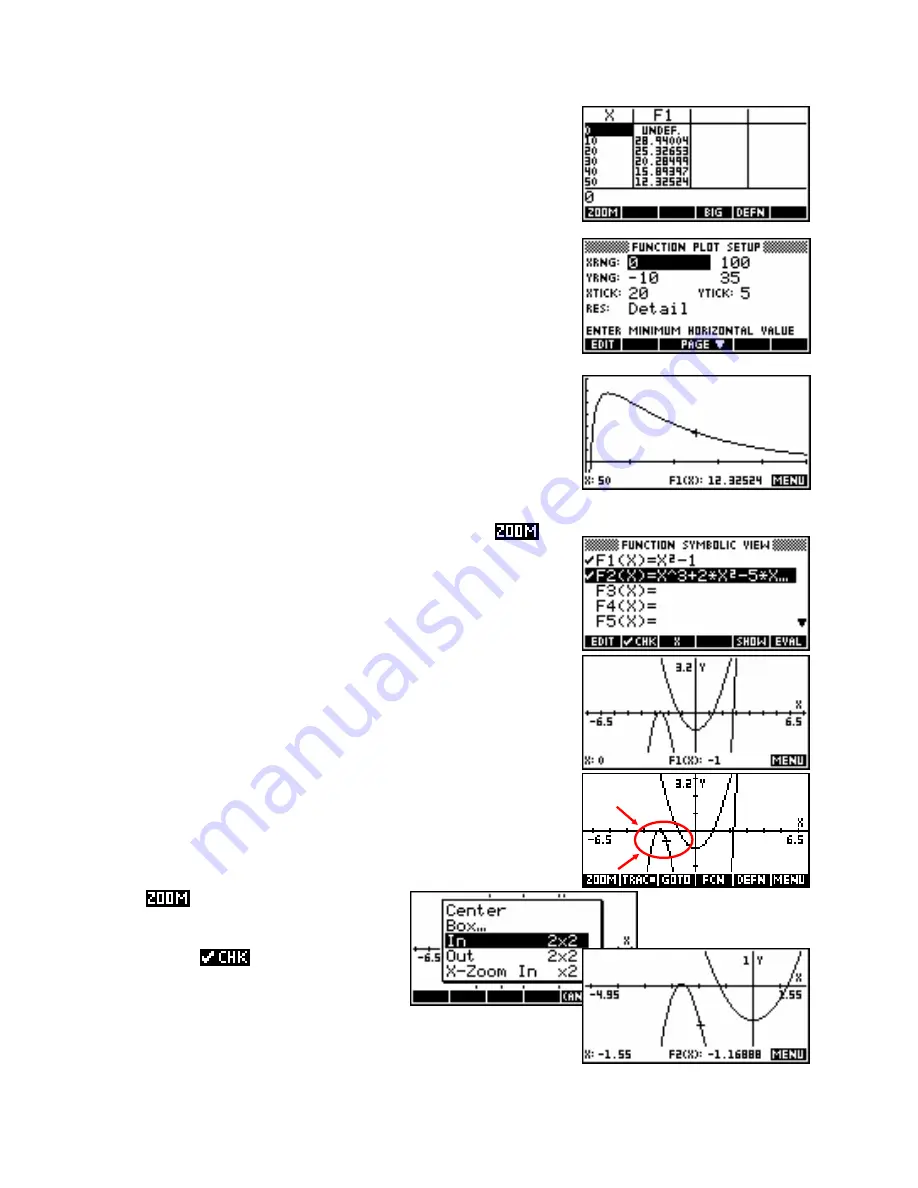
view and scroll through the window from zero to
100. As you do so, take note of the values that the function takes. From
the display it seems that the function peaks around y=30 and then
declines steadily.
Change into the
PLOT SETUP
view and enter an x axis of 0 to 100
with a ‘tick’ value of 20, and a y axis of -10 to 35 with a tick value
of 5.
The result of this is a
PLOT
view as shown right. This would be ideal for
answering questions on the domain stated.
Another possible strategy for graphing which works quite well
and, perhaps importantly, always gives ‘nice’ scales is to use
.
Enter your graphs into the
SYMB
view. Remember that
Auto Scale
only
works on the first ticked graph.
Press
VIEWS
and choose
Decimal
, or press
SHIFT CLEAR
in the
PLOT SETUP
view. This will give you the default axes, probably not
showing the graph very well.
Place the cursor so that it is in the center of the area you are most
interested in.
menu to adjust the view. You
may choose first to change the zoom factors
to something other than 4x4, and to ensure
that
Recenter
is
Use the
ed. The
PLOT
view
on the right is the result of setting 2x2 and re-
center.
63