


F
F
i
i
n
n
d
d
i
i
n
n
g
g
c
c
r
r
i
i
t
t
i
i
c
c
a
a
l
l
p
p
o
o
i
i
n
n
t
t
s
s
a
a
n
n
d
d
g
g
r
r
a
a
p
p
h
h
i
i
n
n
g
g
a
a
p
p
o
o
l
l
y
y
n
n
o
o
m
m
i
i
a
a
l
l
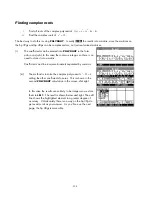
For the function
f x
2
+ +
6
…
( )
=
x
3
−
4
x
x
(i)
find
the
intercepts.
(ii)
find the turning points.
(iii)
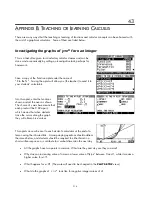
draw a sketch graph showing this information.
(iv)
find the area under the curve between the two turning points.
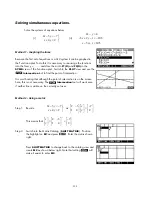
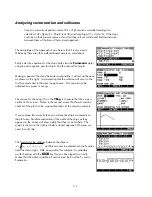
Step 1.
Enter the function into the
SYMB
view of the Function aplet, so
it is available for plotting.
Step 2.
Use the
POLYROOT
function to find the roots. This function is
in the
MATH
menu in the
Polynom.
group. See page 204 for
more information.
−
The results show that the x intercepts are
( 1, 0), (2, 0)
and
(3, 0)
. The y intercept is found by evaluating
F1(0)
in the
HOME
view giving the point (0,6).
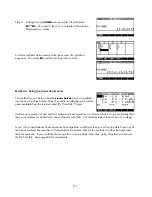
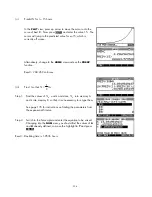
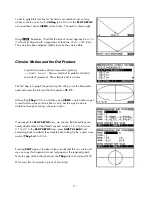
Step 3.
Switching to the
PLOT
view via
VIEWS
-
Decimal
, you will
find that the function does not display as well as it could.
Since it is the y axis that is not displaying enough, we will use
the ‘
Y-Zoom Out
’ option in the
menu after first setting
the
Zoom factors
to 2 rather than 4 (which is too drastic).
The
Zoom factors
setting is also found in the
menu.
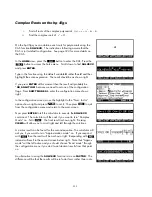
pop-up menu to find the
Extremum
(both
left and right). The snapshot right shows the left-hand turning
point of (0.131,6.065).
Now use the
300