


2
I
I
n
n
f
f
e
e
r
r
e
e
n
n
c
c
e
e
t
t
e
e
s
s
t
t
i
i
n
n
g
g
u
u
s
s
i
i
n
n
g
g
t
t
h
h
e
e
C
C
h
h
i
i
2
2
t
t
e
e
s
s
t
t
Grade
awarded
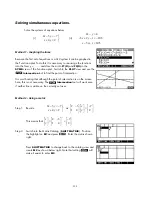
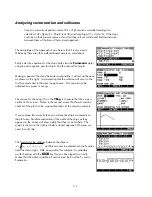
A teacher wishes to decide, at the 5% level of significance,
Year A
B
Total
whether the performance in a problem solving test is
8 22 18 40
independent of the students’ year at school. The teacher
9 26 14 40
selected 120 students, 40 from each of Years 8, 9 & 10, and
10 27 13 40
graded their performance in a test as either A or B.
Total 75 45 120
The table above right shows the results of his testing.
The hypotheses being tested are:
H
0
: There is no relationship between grades awarded
and years at school. They are independent.
H
A
: There is a relationship.
Year
Grade
awarded
A
B
Total
8 25 15 40
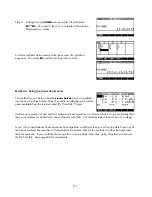
If
H
0
is true then the expected frequencies should be those in the table
on the right.
9
10
Total
25
25
75
15
15
45
40
40
120
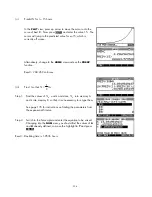
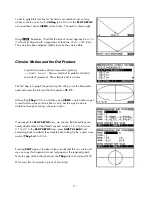
Enter the observed and expected frequencies into columns
C1
and
C2
of
the Statistics aplet.
In the
HOME
view, perform the calculation shown right. This calculates
the individual
χ
2
values ready for summing as per the formula
−
2
χ
=
∑
(
O
E
)
, where
O
and
E
are the observed and expected
E
frequencies.
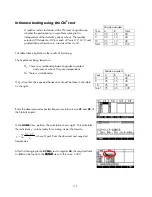
After first changing to the
SYMB
view to register
C3
, the required total
for
C3
can be found in the
view. In this case, 1.493.
312