


SECTION 6 REPORTS
®
making
since 1986
water work
The Hold-Over section of the controller allows you
to:
•
Set positive or negative individual hold over
time per station.
•
Clear an individual stations hold-over time.
•
Clear all station hold over times on
controller.
From the REPORTS menu screen (Figure 6.2).
1.
Press the
HOLD-OVER
Menu key.
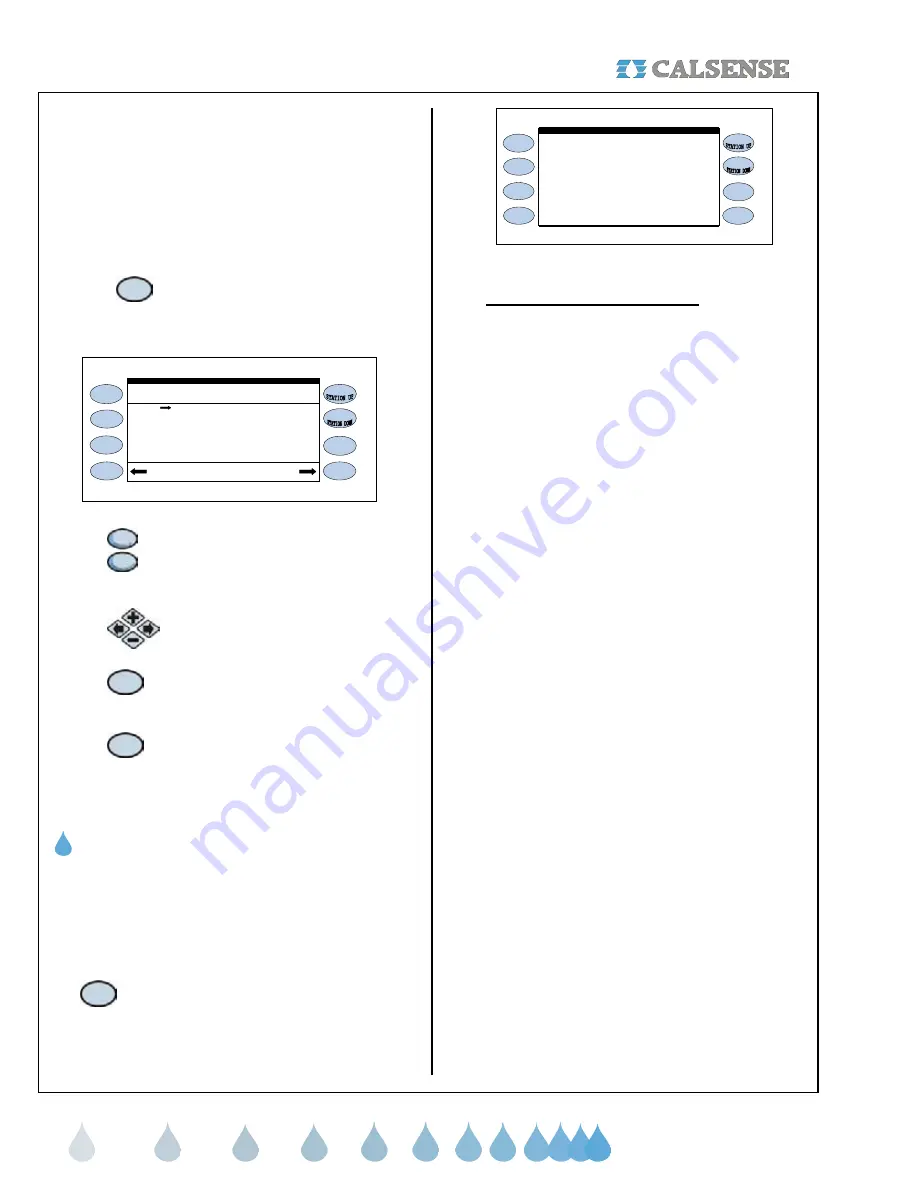
The HOLD-OVER screen is displayed (Figure 6.5).
HOLD-OVER MINUTES
STN HOLD-OVER(mins)
4 2.0
3 1.6
1 0.0
2 0.3
5 0.0
6 0.0
7 2.0
8 3.0
Clear ALL Clear Station
Figure 6.5
2.
Press the
STATION UP /
STATION DOWN
Menu key to
view each station assigned.
3.
Press the
PLUS
or
MINUS
keys to
change station values.
4.
Press the
CLEAR STATION
Menu
key to clear all hold over for that
particular station.
5.
Press the
CLEAR ALL
menu key
to clear all stations at one time.
THIS CONCLUDES THE HOLD-OVER SECTION
D. ET & RAIN TABLES
The ET & Rain Table section of the controller allows
you to look at the last consecutive 28 days of ET
and Rain data.
From the REPORTS menu screen (Figure 6.2).
1.
Press the
ET & RAIN TABLES
Menu key.
The ET & RAIN TABLE screen is displayed
(Figure 6.6).
g.30 g.29 e.28 g.30 c.28 g.29 h.31
ET & RAIN TABLE
Thu Wed Tue Mon Sun Sat Fri
h.31 h.31 h.31 h.31 h.31 h.31 h.31
h.31 h.31 h.31 h.31 h.31 h.31 h.31
h.31 h.31 h.31 h.31 h.31 h.31 h.31
ET Table: (from 08/25/2005 back) 3
o.00 o.00 o.00 o.00 o.00 o.00 o.00
o.00 o.00 o.00 o.00 o.00 o.00 o.00
Rain Table: (table: 4 report: 14 )
Thu Wed Tue Mon Sun Sat Fri
o.00 m.05 r.12 s m.02 o.00
o.00 o.00 o.00 o.00 o.00 o.00 o.00
Figure 6.6
1. Reports / ET & Rain table (ET)
The ET Table (Figure 6.6) is where the controller
stores daily ET numbers (measured in inches). The
numbers in the table are used to determine the
amount of irrigation to be applied by each station
and can be generated from the following sources:
o
Automatically generated from an ET
Gage wired to the controller.
o
Automatically generated from Campbell
Scientific weather station.
o
Automatically shared from another
controller connected to an ET Gage
using Calsense Command Center
software. (Controllers must have
communication capabilities to share
ET).
o
Historical ET which is automatically
entered into the ET Table when Daily
ET is enabled, and remains in the table
until it is replaced by real time ET from
an ET gage or manually edited by the
user.
o
Manually edit the ET Table.
The ET table stores the last 28 days of ET numbers.
In the example in Figure 6.6 the ET table has a
combination of Historical ET, actual real-time ET and
user edited ET. The letter next to each number
indicates how the number got into the ET Table:
h – historical
This means the (ET) number was
retrieved from the historical (ET) table.
g – ET Gage
This means the (ET) number was
retrieved from an actual real-time (ET) gage.
e – edited
This means the (ET) number was edited
at the controller by a user.
c – Central
This means the central created the (ET)
value due to the real-time (ET) value being below
the minimum (ET) set by the user.
Prior to irrigation, the controller will read the number
in the ET table and use it to recalculate the irrigation
run times for each station.


