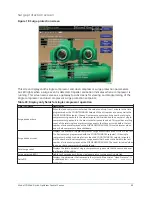


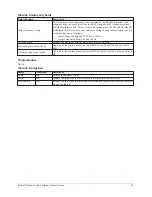


Table 54: Display only fields
Field/LED name
Description
Lag compressor control
Displays the control state of the lag compressor. See Table 55 for the lag compressor
states.
Time remaining
Displays the time remaining on the following timers:
•
“Waiting for Pulldown Delay”
•
“Waiting Minimum Run Time”
•
“Waiting Minimum Rate Time”
•
“Waiting Maximum Delta T Time”
•
“Waiting Minimum Load Time”
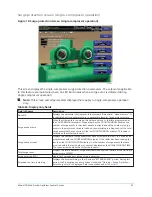
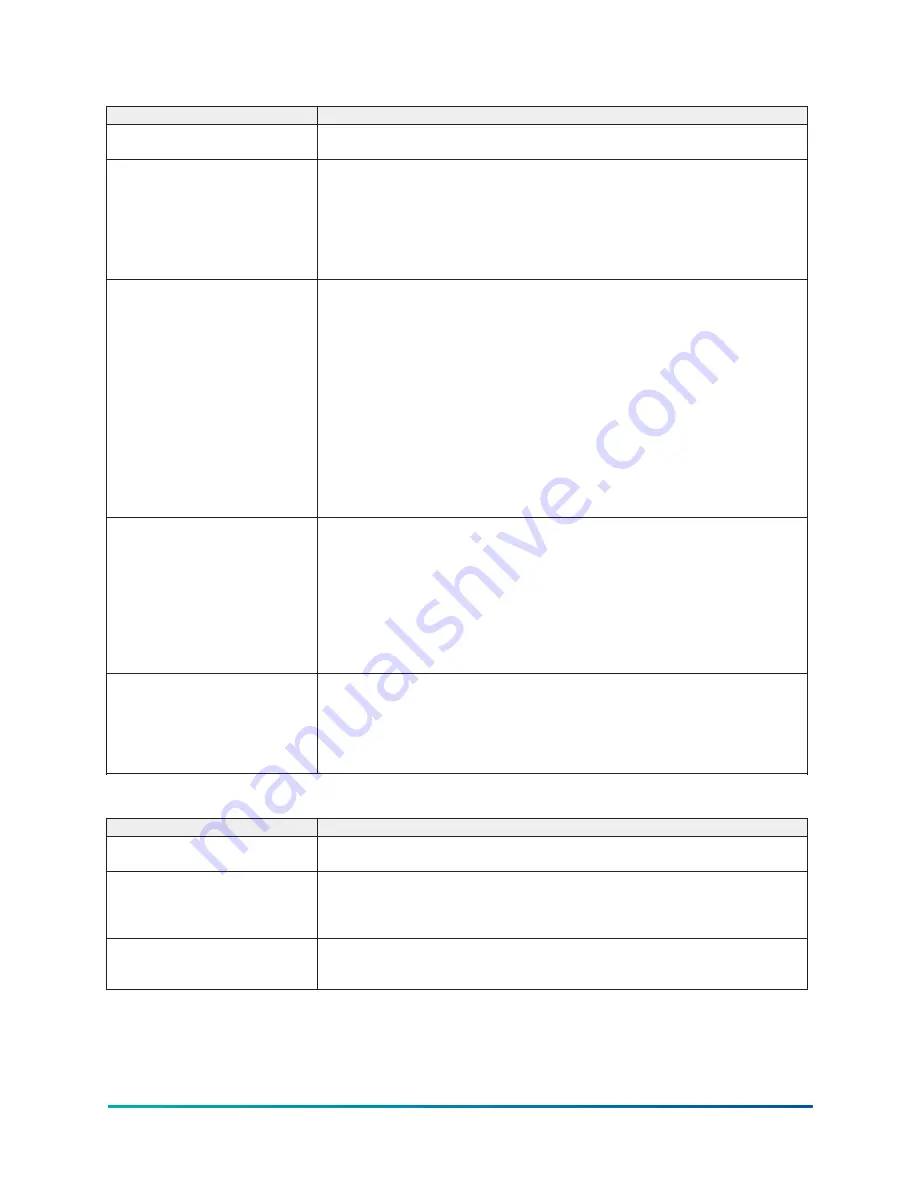
Minimum rate and minimum rate
time
Access level required: View
Allows the user to define the minimum rate of change of the Leaving Chilled Liquid
Temperature that must be met by the lead compressor during the Chiller Pulldown
Period (this period is in effect until the Leaving Chilled Liquid Temperature is within
2ºF of setpoint). If this requirement is not being met, the lag compressor is started.
After the lead compressor has been running for 3 minutes, the Leaving Chilled Liquid
Temperature is sampled once every minute for 5 minutes to establish a 5 point rolling
average that makes up the displayed Delta T Rate value. This 8 minute period is the
Pulldown Delay Period. See Waiting For Pulldown Delay in Table 55.
When the Pulldown Delay is finished, and for the remainder of the Chiller Pulldown
Period, if the Delta T Rate is less than the Minimum Rate Setpoint (0.5ºF/minute to
2.0ºF/minute; default 1.0ºF/ minute) for a period equal to the Minimum Rate Time
Setpoint (1 to 20 minutes; default 5 minutes) and the Pulldown Demand Limit Setpoint
is above 50%, the lag compressor is brought on line.
Maximum Delta T and maximum
Delta T time
Access level required: View
Allows the user to define the criteria that determines if the lead compressor is meeting
the load requirement during the Chiller Steady State Period. If the requirement is not
being met, the lag compressor is started. After the Chiller Pulldown Period has ended,
the Chiller Steady State Period begins and is in effect until the chiller is shutdown.
During this period, if the Temperature Differential (Leaving Chilled Liquid temperature
minus Setpoint) exceeds the Maximum Delta T Setpoint (1.0ºF to 5.0ºF; default 1.0ºF)
for a period equal to the Maximum Delta T Time Setpoint (1 to 20 minutes; default 5),
the lag compressor is brought online.
Low load and low load time
Allows the user to define the criteria that determines if the lag compressor should be
shutdown because the lead compressor is meeting the load requirement. After the 30
minute Minimum Run Time, if the lead compressor motor current goes below the Low
Load Setpoint (20% to 60%; default 45%) for a period of time equal to the Low Load
Time Setpoint (1 to 20 minutes; default 5), a Soft Shutdown will be performed on the
lag compressor. See Waiting Minimum Run Time in Table 55.
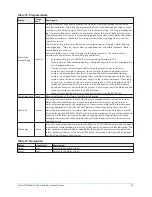
Table 55: Lag compressor control states
Control state
Description
Stopped
The lag compressor is in this state when locked out, in anti-recycle, its vane motor
switch is open or shutdown by the surge protection feature.
Inhibited
The lag compressor is prevented from running because the
Chiller Pulldown
Demand Limit Setpoint
is less than or equal to 50% (during the chiller pulldown
period) or the
Chiller Current Limit Setpoint
is less than or equal to 50%
(during the chiller steady state period), but is otherwise able to run.
Waiting for pulldown delay
Displayed during the first 8 minutes of the chiller pulldown period. Delay consists of
a 3 minute bypass when the chiller first enters the run state followed by a 5 minute
evaluation period to establish the first 5-point rolling average of the Delta T Rate.
69
Model YD Mod D with OptiView Control Center
Summary of Contents for YD Mod D
Page 2: ...2 Model YD Mod D with OptiView Control Center...
Page 8: ...Nomenclature Model YD Mod D with OptiView Control Center 8...
Page 17: ...Figure 2 Chiller operation flow chart 17 Model YD Mod D with OptiView Control Center...
Page 18: ...Figure 2 Chiller operation flow chart Model YD Mod D with OptiView Control Center 18...
Page 19: ...Figure 2 Chiller operation flow chart 19 Model YD Mod D with OptiView Control Center...
Page 20: ...Figure 2 Chiller operation flow chart Model YD Mod D with OptiView Control Center 20...
Page 21: ...Figure 2 Chiller operation flow chart 21 Model YD Mod D with OptiView Control Center...
Page 22: ...Figure 2 Chiller operation flow chart Model YD Mod D with OptiView Control Center 22...
Page 150: ...Figure 57 Sample printout status Model YD Mod D with OptiView Control Center 150...
Page 151: ...Figure 57 Sample printout status 151 Model YD Mod D with OptiView Control Center...
Page 152: ...Figure 58 Sample printout setpoints Model YD Mod D with OptiView Control Center 152...
Page 153: ...Figure 58 Sample printout setpoints 153 Model YD Mod D with OptiView Control Center...
Page 154: ...Figure 59 Sample printout schedule Model YD Mod D with OptiView Control Center 154...
Page 155: ...Figure 60 Sample printout sales order 155 Model YD Mod D with OptiView Control Center...
Page 156: ...Figure 61 Sample printout history Model YD Mod D with OptiView Control Center 156...
Page 157: ...Figure 61 Sample printout history 157 Model YD Mod D with OptiView Control Center...
Page 159: ...Figure 64 Sample printout custom screen report 159 Model YD Mod D with OptiView Control Center...