2-19
IM AQ7280-01EN
Optical Pulse Measurement (OTDR)
1
2
3
4
5
6
7
8
Index
Setting Analysis Conditions
Press the
Analysis Setup
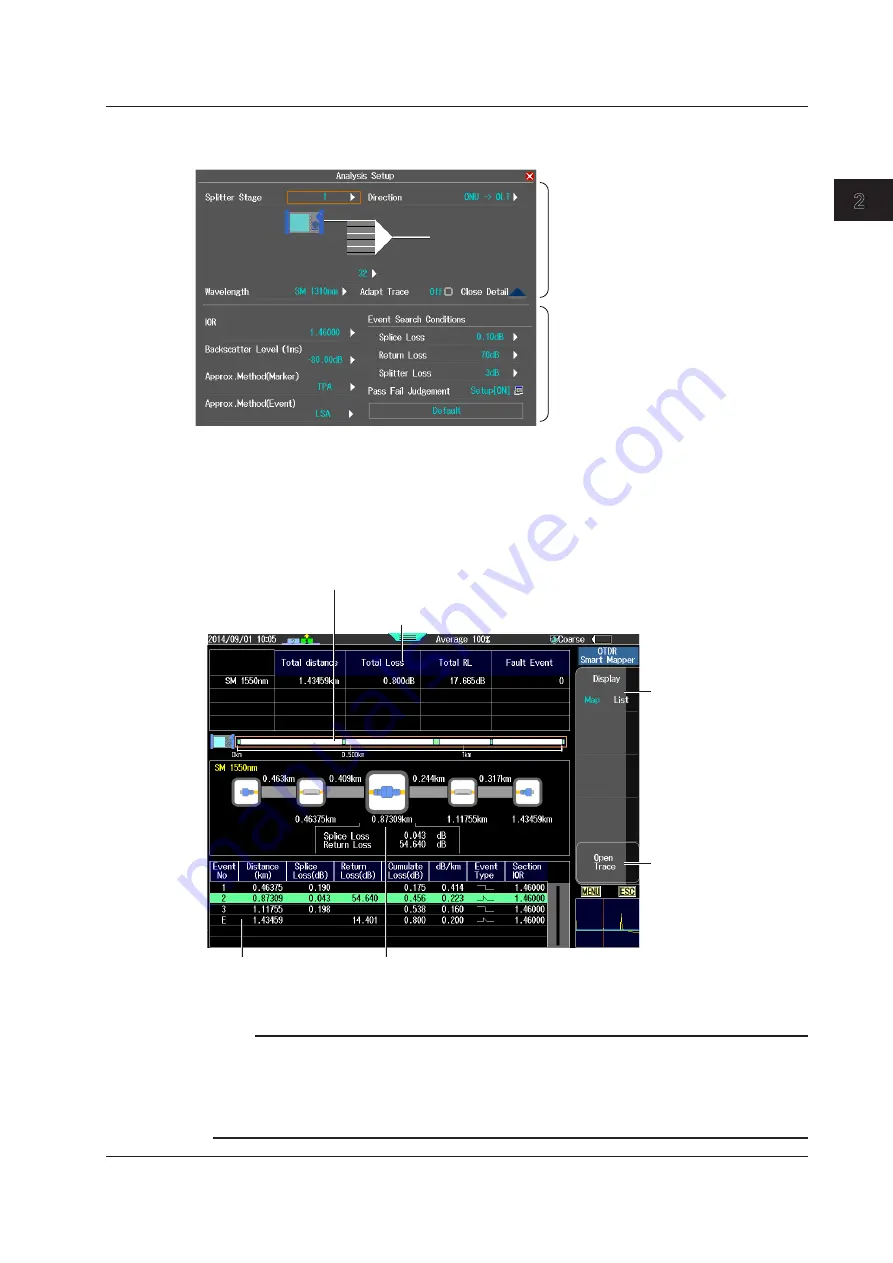
soft key to display the following screen.
Set the splitter and wavelength.
See “Setting Measurement
Conditions” on the previous page.
For details on analysis items, see
pages 2-10 to 2-13.
Starting and Stopping Measurements
3.
Press
AVG
. Averaged measurement begins, and a screen indicating that the measurement is
in progress appears. When the averaged measurement finishes, icons and analysis results of
events are automatically displayed.
4.
Using the
rotary knob
and
ENTER
, select the icon of the event you want to display the details
of. The icon of the selected event appears in the center of the screen.
Selects the display screen
(Map, List)
The example shown here is
Map.
Check the waveform.
The screen will change
from Map/List display to
measurement waveform
display.
Event screen
See section 4.2.
The total value of each event (the value of each
waveform in multi wavelength measurement)
The event positions displayed on the screen is enclosed in a frame.
Event icon display
The event selected on the event screen appears in the center, and the splice
loss and return loss are displayed. Drag the icon screen to move it horizontally.
Tap the icon screen to change the event type.
Note
• To stop the averaged measurement in progress, press AVG. The averaged measurement will stop, and
the screen that was showing before the measurement will reappear.
• During averaged measurement, you cannot set the measurement conditions.
• You can start averaged measurement by pressing AVG even while the measurement setting screen is
showing.
• In OTDR Smart Mapper, real-time measurement is not possible.
2.3 Performing Averaged Measurement and Displaying the Results with Icons (/SMP option)


