1. OUTLINE
IMR01N12-E7
8
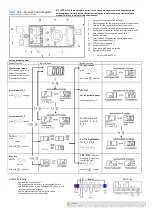
Upper display
Measured value 1 (PV1) lamp
[Green]
Lights when measured value 1 is displayed on the
PV1/PV2 display unit.
Measured value 2 (PV2) lamp * [Green]
Lights when measured value 2 is displayed on the
PV1/PV2 display unit.
Manual (MAN) mode lamp
[Green]
Lights when operated in manual mode.
Remote (REM) mode lamp
[Green]
Lights when remote setting function is activated.
Autotuning (AT) lamp
[Green]
Flashes when autotuning is activated.
(After autotuning is completed: AT lamp will go out)
Measured value (PV1/PV2) display
Displays PV1, PV2 or various parameters’ symbols.
* This lamp is activated only with 2-input controller.
Lower display
Measured value 2 (PV2) lamp * [Green]
Lights when measured value 2 is displayed on the SV display unit.
Set value (SV) lamp
[Green]
Lights when Set value (SV) is displayed on the SV display unit.
Manual (MAN) mode lamp *
[Green]
Lights when operated in manual mode.
Autotuning (AT) lamp *
[Green]
Flashes when autotuning is activated.
(After autotuning is completed: AT lamp will go out)
Set value (SV) display
Displays SV, PV2 or various parameters’ set values.
* This lamp is activated only with 2-input controller.
Area display
Area (AREA) lamp
[Green]
Lights when memory area number is displayed.
Memory area display
Displays memory area number (1 to 16).
Output/Alarm lamp
Output (OUT1 to OUT5) lamp
[Green]
Lights when the output corresponding to each lamp is ON.
Alarm (ALM) lamp
[Red]
Lights when alarm (Event function) is turned on.
The type of alarm which is on can be checked on the event monitor display.
These lamps works with outputs (control, alarm, retransmission) which are assigned to OUT1 through OUT5.
For assignment of outputs to OUT1 through OUT5, refer to Output Logic Selection. (P. 76)
Bar graph display [Green] *
One of the displays shown in the table below can be selected for the bar graph.
Manipulated output value (MV) display
Displays the Manipulated output value (MV). When Manipulated output value (MV) is
at 0 % or less, the left-end dot of the bar-graph flashes. When MV exceeds 100 %, the
right-end dot flashes.
Measured value display
Displays the Measured value (PV). Scaling is available within the input range.
Set value display
Displays the Set value (SV). Scaling is available within the input range.
Deviation display
Displays the deviation between the Measured value (PV) and the Set value (SV).
When the Deviation display is selected, the dots at both ends of bar-graph light.
* The number of dots: 10 dots (HA430)
20 dots (HA930)
Bar graph display can be selected in the Engineering
m
ode. Refer to selecting the bar graph display (P. 63).
[Example]
0
50
100
0
[Example]
[Example]
0
50
100
[Example]
0
50
100


