


30
9
)
A3.17
=
4÷10×100
%=
40.0
%,
the percentage that
inflection1 refererece (4V) of curve 4 corresponds to the
10V
10
)
A3.18
=
10.00Hz÷A0.08*100
%,
set the percentage
that inflection1 reference (4V) of curve 4 corresponds
to the reference frequency.
11
)
A3.19
=
0.5÷10×100
%=
5.0
%,
set the percentage
that the Minimum reference(0.5V) of curve 4
corresponds to the 10V
12
)
A3.20
=
50.00Hz÷A0.08*100
%,
set the percentage
that the minimum reference(0.5V) corresponds to the
reference frequency.
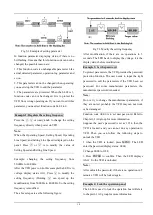
Fig.6-10 Pulse signal input 1
If there is no setting of inflection point in the 3rd
requirement,means to change the requirement as 0.5V
input signal corresponds to 50Hz reference frequency,
and 10V input signal corresponds to 5Hz reference
frequency.Then we can set the inflection point 1 the
same as Min. reference(A3.17
=
A3.19
,
A3.18
=
A3.20)
and inflection point 2 the same as Max. reference(A3.13
=
A3.15
,
A3.14
=
A3.16).As shown in Fig.6-11.
Fig.6-11 Pulse signal input 2
Note:
1
.
If user set the reference of inflection point 2 of curve
4the same as Max. reference(A3.15=A3.13),then the
drive will force A3.16=A3.14,means the setting of
inflection point 2 is invalid.If reference of inflection
point 2 is the same as reference of inflection point
1(A3.17
=
A3.15),then the drive will force
A3.18=A3.16,means the setting of inflection point is
invalid.If reference of inflection point 1 is the same as
Min. reference(A3.19
=
A3.17),then the drive will force
A3.20=A3.18,means the setting of Min. reference is
invalid.The setting of curve 1 is in the same manner.
2
.
The range of the actual value that corresponds to the
reference of curve 1,2,3 and 4 is 0.0
% ~
100.0
%
,corresponds to torque is 0.0
%~
300.0
%
,and
corresponds to frequency,its range is 0.0
%~
100.0
%。
6.5 Group A4
A4.00 Acc/Dec mode
0
~
1
【
0
】
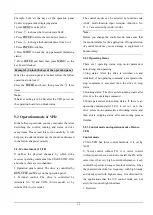
0:Linear Acc/Dec mode
Output frequency increases or decreases according to a
constant rate, as shown in Fig. 6-12.
Fig.6-12 Linear Acc/Dec
1:S curve Acc/Dec mode.
The output frequency accelerates and decelerates
according to S curve,as shown in Fig.6-13.
A3.13
A3.15
A3.17
A3.19
Pulse signal input
Output frequency(%)
.
A3.14=10%
5
%
4
0
%
6
0
%
1
0
0
%
A3.16=80%
A3.18=20%
A3.20=100%
Frequency
Time
F
max
t
1
t
2


