27
_____________________________________________________________________________________________
5.3 Making Changes to the Voltage Axis
______________________________________________________________________________________________
5.2.3 Changing the Type of Display
5.2.4 Changing the Character Color and Font
5.3.1 Changing the Magnification of the Voltage Axis
5.3.2 Changing the Gage Type
5.3 Making Changes to the Voltage Axis
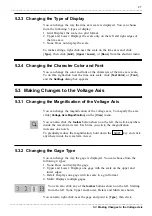
You can change the way the time axis scale is displayed. You can choose
from the following 3 types of display:
1. Grid: Displays the scale in a grid format.
2. Upper and Lower: Displays the scale only on the left and right edges of
the time axis.
3. None: Does not display the scale.
To make settings, right-click near the scale on the time axis and click
[
Type
], then click [
Grid
], [
Upper / Lower
], or [
None
] from the shortcut menu.
You can change the color and font of the characters of the time axis scale.
To do this, right-click near the time axis scale, click [
Text Color
] or [
Font
],
and the
Settings
dialog box appears.
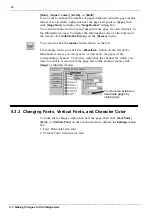
You can change the magnification of the voltage axis. To magnify the axis,
click [
Voltage Axis Magnification
] on the [
View
] menu.
You can also click the
toolbar
button shown on the left, then click anywhere
inside the waveform viewer. Each time you click, the magnification
increases one notch.
To gradually reduce the magnification, hold down the
SHIFT
key and click
anywhere inside the waveform viewer.
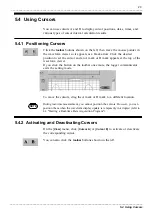
You can change the way the gage is displayed. You can choose from the
following 4 types:
1. None: Does not display the gage.
2. Upper and Lower: Displays one gage with the scale on the upper and
lower edges.
3. Detail: Displays one gage with its scale in a grid format.
4. Multi: Displays multiple gages.
You can also click any of the
toolbar
buttons shown on the left. Starting
from the left: None, Upper and Lower, Detail, and Multi are shown.
You can also right-click near the gage and point to [
Type
], then click

