2. PLOTTER
2-9
• Tap a location on the chart.
From a tide station
Tap the tide station to show the chart pop up menu, then tap [Chart Info] => [Tide
Height Station] => [Graph]. Tide graph for the selected tide station appears.
From the slide-out menu or [Home] screen
From the [Home] screen, tap [Tide], or swipe the right-hand side of the screen left-
wards to show the slide-out menu, then tap [Tide]. The graph shows tide information
from the closest tidal station to your present location. If there is no tide station nearby,
the message "There is no Tide Station near you." appears.
From the chart
Tap the desired location on the chart to show the pop up menu, then tap [Chart Info].
If there is a tide station nearby, the tide station appears with other chart objects in the
object list, at the left side of the screen. Drag the list to show chart objects which are
not displayed on the screen. Tap [Tide Height Station] => [Graph] to show the tide in-
formation for the selected chart area. (See section 2.10.)
2.14.2
How to view tidal current information
Provided your chart card has tidal current information, you can view current informa-
tion on the plotter screen. If you do not have a chart card, you can also view tidal cur-
rent information from the C-Weather overlay (see section 2.13).
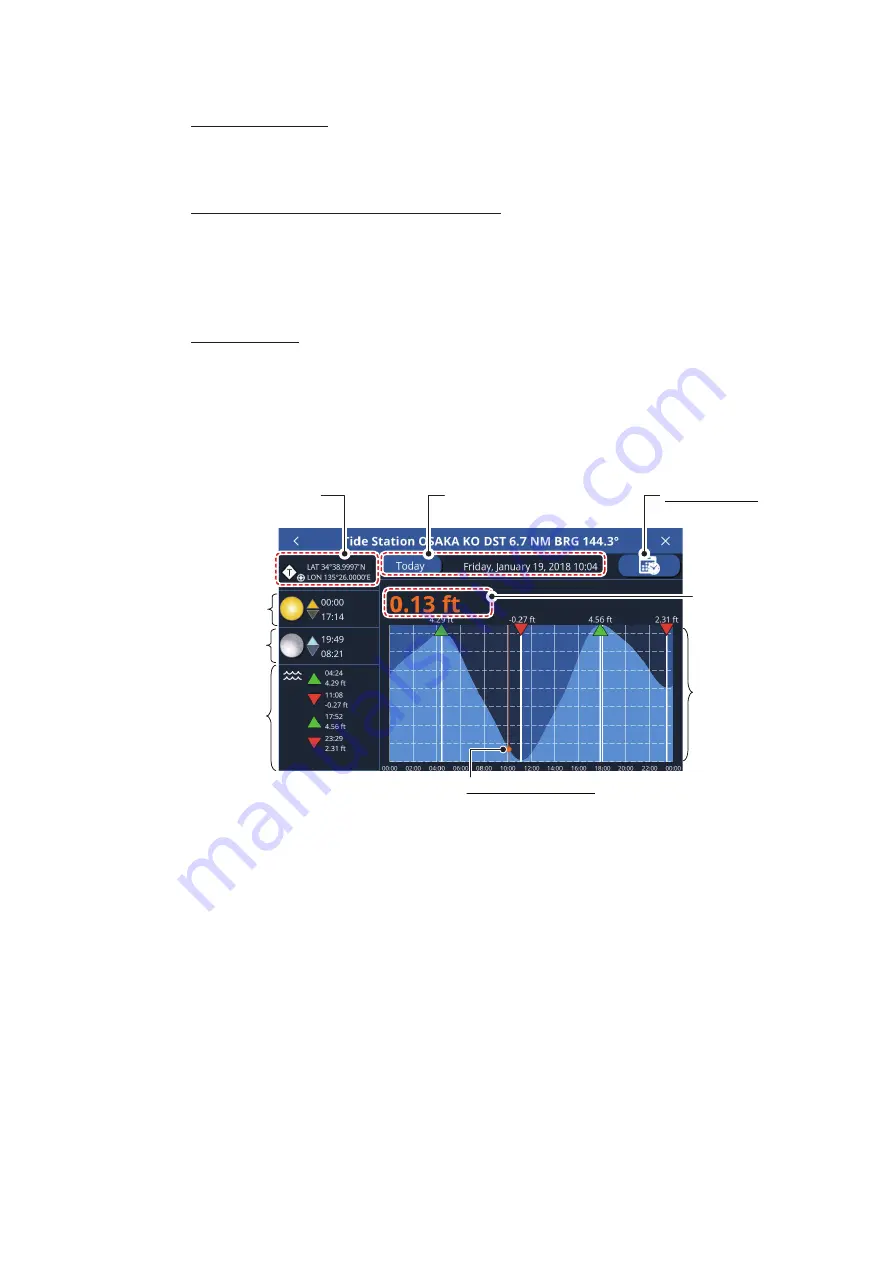
Current information appears as indicated in the following figure.
Tide station’s latitude
and longitude
Sunrise and
sunset times
Moonrise and
moonset times
Time and
height for high
and low tides
Time selection icon
Drag the icon to the left or right to
change the selected time.
Time and date of currently
displayed tide information
Calendar icon
Tap to select a date.
Tide height at
selected time
Time appears
from left to right
on the X axis,
height appears
on the Y axis.


