2-1
2.
PLOTTER
2.1
Plotter Overview
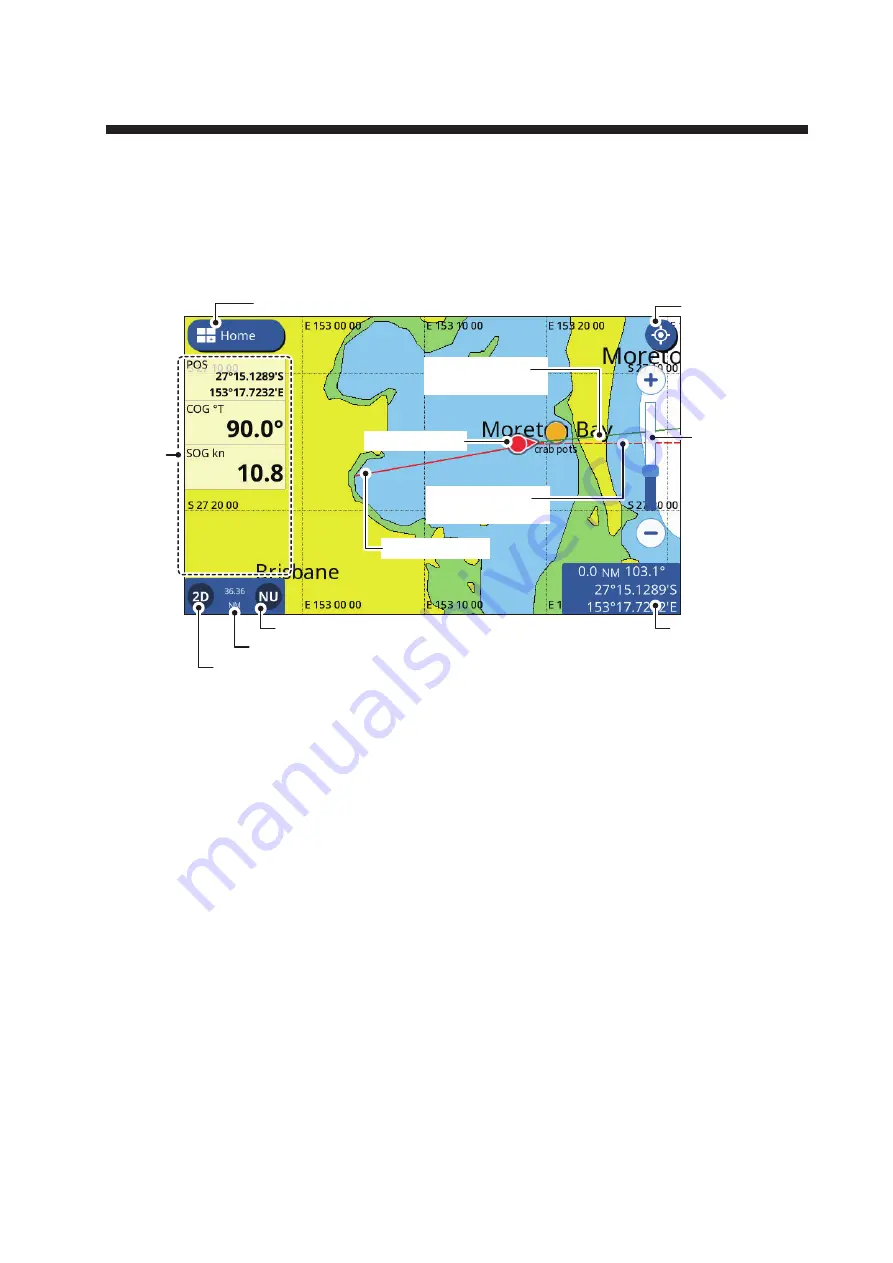
The Plotter page can be displayed in full-screen, or with the Radar, Fish Finder or In-
struments pages.
2.2
How to Select a Chart Type
You can select one of four chart types for your plotter page. The available chart types
are [Vector], [Shaded Relief], [Satellite] and [Raster Chart].
1. Swipe the bottom of the plotter page upwards to show the layered menu.
2. Tap [Chart Type] to show the chart types.
3. Tap the chart type you want to use.
4. Tap the [<] icon at the top-left of the chart type list.
5. Swipe the layered menu downwards to close the menu.
[Home] icon
COG Vector
(red dashed line)
Heading line
(green solid line)
Cursor data box
Orientation mode
Data
area
Display range
2D/3D icon
Note:
When the unit for Depth (see section 11.2) is set to pb or HR, the following
changes are also applied to the displayed depth values.
• The depth value shown in the data area and on the fish finder screen appears in
pb/HR.
• The depth values shown on the chart appears in m (meters).
• The depth values for Underwater Objects/Display Limit filters are changed to
pb/HR, however the chart-displayed values remain in m (meters).
Center icon
(returns own ship
to screen center)
Range
slide
bar
Own ship track
Own ship icon


